
Image
|
Figure Caption
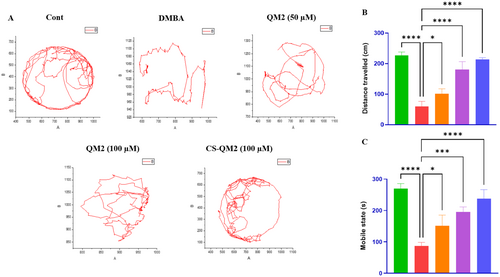
Fig. 6 Representation of the locomotion behavior of zebrafish larvae. (A) Free swimming trajectory locomotion analysis of zebrafish larvae for 5 min; Statistical representation of (B) total distance covered by larvae and (C) mobile state of larvae. Data are presented as mean ± standard deviation of replicates. The asterix represents the statistical significance compared to the DMBA group.
Acknowledgments
This image is the copyrighted work of the attributed author or publisher, and
ZFIN has permission only to display this image to its users.
Additional permissions should be obtained from the applicable author or publisher of the image.
Full text @ J. Biochem. Mol. Toxicol.