
|
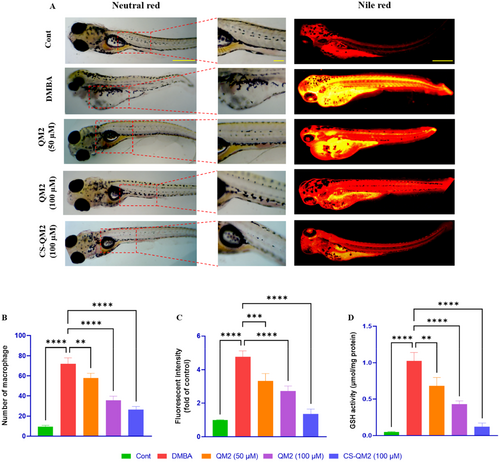
Fig. 5 Representation of the macrophage accumulation and fluorescent photomicrograph of zebrafish larvae. (A) Visualization of macrophage accumulation and neutral lipid droplets in zebrafish larvae using neutral red stain and nile red stain. (B) Statistical representation of macrophage accumulations; (C) Statistical representation of relative fluorescent intensity (fold of control) of zebrafish larvae. (D) Estimation of GSH activity in zebrafish larvae. Data are presented as mean ± standard deviation of replicates. The asterix represents the statistical significance compared to the DMBA group. Scale bar: 400 µm and 100 µm.