
|
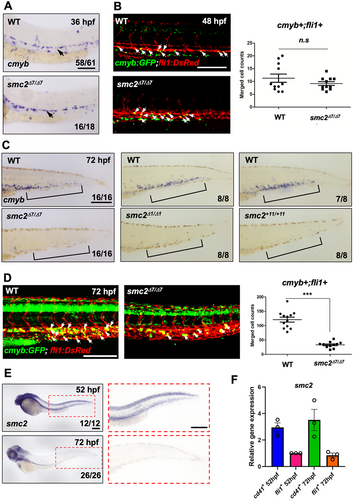
Fig. 3 SMC2 is required for hematopoietic stem and progenitor cell (HSPC) maintenance. (A) WISH of smc2 mutant embryos and WT controls using HSPC marker cmyb in the dorsal aorta (black arrows). The numbers shown at the bottom of the images represent the count of representative outcomes observed relative to the total number of embryos obtained. Results from three independent experiments. (B) Confocal imaging of smc2 mutant embryos and sibling controls with a cmyb:GFP;fli1:DsRed transgenic background at 48 hpf (white arrows indicate HSPCs). Right panel: quantification of cmyb+;fli1+ double positive cells in the dorsal aorta at 48 hpf (WT, n = 11; mutants, n = 10). Data were quantified and expressed as the mean ± SEM. Statistical analysis was performed using a t-test to calculate p-values (n.s., no significance at p > 0.05). Data from a single experiment. (C) WISH using a HSPC-specific cmyb antisense probe of three distinct smc2 mutant embryos and their WT controls in caudal hematopoietic tissue (CHT) at 72 hpf. Black square brackets indicate CHT. Data obtained from a single experiment. (D) Confocal imaging of WT embryos and smc2 mutants at 72 hpf using cmyb:GFP;fli1:DsRed transgenic zebrafish. White arrows indicate HSPCs. Right panel: quantification of cmyb+;fli1+ double positive HSPCs in the CHT at 72 hpf (WT, n = 11; mutants, n = 10; ***p < 0.001). Results from two independent experiments. Statistical analysis was performed using a t-test to calculate p-values. (E) Transcriptional expression of smc2 during embryogenesis with smc2 WISH of WT embryos at 52 and 72 hpf. The red-dotted box is a magnified image of the CHT at 52 and 72 hpf. Combined data from two independent experiments. (F) qPCR analysis of smc2 expression in CD41-positive HSPCs and fli1-positive endothelial cells at 52 and 72 hpf. The expression levels of smc2 were normalized to the β-actin, with results presented as relative fold changes. Data were quantified and expressed as the mean ± SEM of three independent biological replicates. Scale bar = 200 μm.