
- Title
-
SMC2 and Condensin II Subunits Are Essential for the Development of Hematopoietic Stem and Progenitor Cells in Zebrafish
- Authors
- Oh, C.K., Kim, M.S., Shin, U., Kang, J.W., Kim, Y.H., Ko, H.S., Ra, J.S., Ahn, S., Choi, E.Y., Yu, S., Nam, U., Choi, T., Myung, K., Lee, Y.
- Source
- Full text @ J. Cell. Physiol.
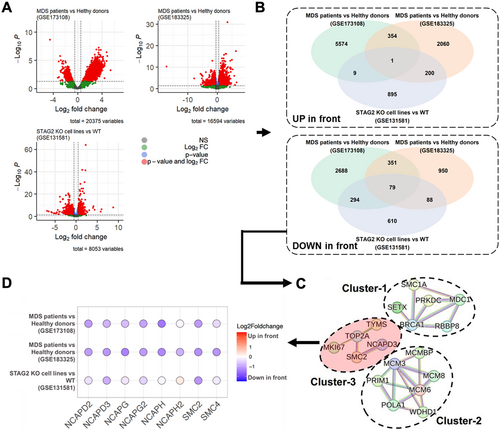
Selection procedure of target proteins using RNA-seq datasets of MDS-associated samples via three different comparisons. (A) Volcano plots of significantly differentially expressed MDS-associated genes for the three comparisons: (i) MDS patients versus healthy donors (GSE173108), (ii) MDS patients versus healthy young adults (GSE183325), and (iii) STAG2 knock-out (KO) HL-60 cells versus WT HL-60 cells (GSE131581). (B) Venn diagrams comparing the three DEGs for up/downregulations. (C) Protein–protein interaction (PPI) networks connected using significant DEGs. (D) Transcriptional profiles of the condensin family across the three comparisons. |
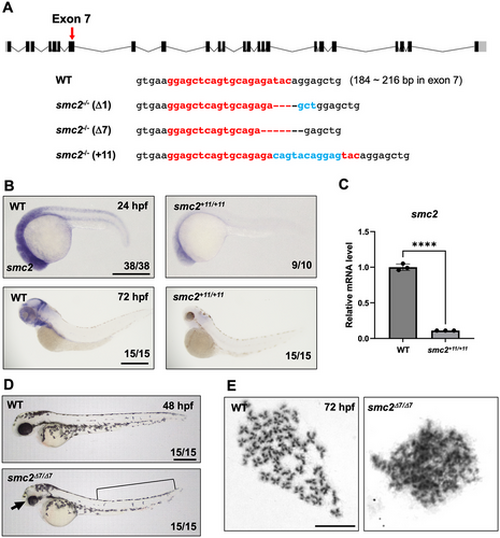
Generation of smc2 mutants via CRISPR/Cas9 mutagenesis. (A) A diagram of smc2 targeted by a sgRNA at exon 7 (a red arrow) and the sequences of three different smc2 mutant alleles generated using CRISPR/Cas9 mutagenesis. Numbers in parentheses with WT sequences indicate the position in the open reading frame of the targeted exon 7 of smc2. The sgRNA sequence is shown in red bold letters. Deletions are illustrated as dashed lines and insertions as blue letters. (B) Whole-mount in situ hybridization (WISH) using a smc2 probe of smc2 mutant embryos and its WT sibling controls at 24 and 72 h post fertilization (hpf). The numbers shown at the bottom of the images represent the count of representative outcomes observed relative to the total number of embryos obtained. Data from two independent experiments. Scale bar = 400 μm. (C) Quantitative PCR (qPCR) analysis assessing the relative expression levels of the smc2 gene in WT and smc2 null mutant zebrafish embryos at 72 hpf. Expression levels of smc2 were normalized to β-actin, with results presented as relative fold changes. Data were quantified and expressed as the mean ± standard error of the mean (SEM) from three independent biological replicate experiments. Statistical analysis was performed using a t-test to calculate p-values. (****p < 0.0001). (D) Lateral view of smc2 mutant embryos and WT controls at 48 hpf. smc2 mutants demonstrated morphological defects in the head (black arrow) and yolk extension (black square bracket). Data from two independent experiments. Scale bar = 400 μm. (E) Chromosome-spreading assay of WT and smc2 mutant embryos at 72 hpf from three independent experiments performed. The scale bar indicates the designated length in the images. Scale bar = 10 μm. |
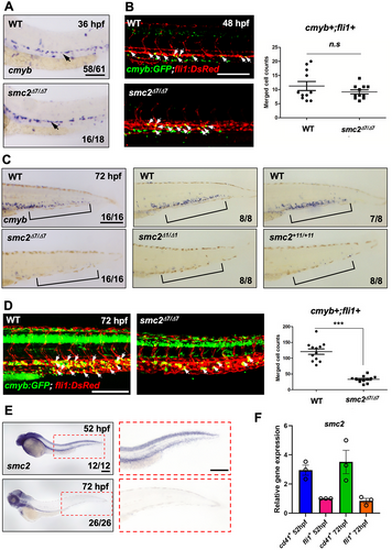
SMC2 is required for hematopoietic stem and progenitor cell (HSPC) maintenance. (A) WISH of smc2 mutant embryos and WT controls using HSPC marker cmyb in the dorsal aorta (black arrows). The numbers shown at the bottom of the images represent the count of representative outcomes observed relative to the total number of embryos obtained. Results from three independent experiments. (B) Confocal imaging of smc2 mutant embryos and sibling controls with a cmyb:GFP;fli1:DsRed transgenic background at 48 hpf (white arrows indicate HSPCs). Right panel: quantification of cmyb+;fli1+ double positive cells in the dorsal aorta at 48 hpf (WT, n = 11; mutants, n = 10). Data were quantified and expressed as the mean ± SEM. Statistical analysis was performed using a t-test to calculate p-values (n.s., no significance at p > 0.05). Data from a single experiment. (C) WISH using a HSPC-specific cmyb antisense probe of three distinct smc2 mutant embryos and their WT controls in caudal hematopoietic tissue (CHT) at 72 hpf. Black square brackets indicate CHT. Data obtained from a single experiment. (D) Confocal imaging of WT embryos and smc2 mutants at 72 hpf using cmyb:GFP;fli1:DsRed transgenic zebrafish. White arrows indicate HSPCs. Right panel: quantification of cmyb+;fli1+ double positive HSPCs in the CHT at 72 hpf (WT, n = 11; mutants, n = 10; ***p < 0.001). Results from two independent experiments. Statistical analysis was performed using a t-test to calculate p-values. (E) Transcriptional expression of smc2 during embryogenesis with smc2 WISH of WT embryos at 52 and 72 hpf. The red-dotted box is a magnified image of the CHT at 52 and 72 hpf. Combined data from two independent experiments. (F) qPCR analysis of smc2 expression in CD41-positive HSPCs and fli1-positive endothelial cells at 52 and 72 hpf. The expression levels of smc2 were normalized to the β-actin, with results presented as relative fold changes. Data were quantified and expressed as the mean ± SEM of three independent biological replicates. Scale bar = 200 μm. |
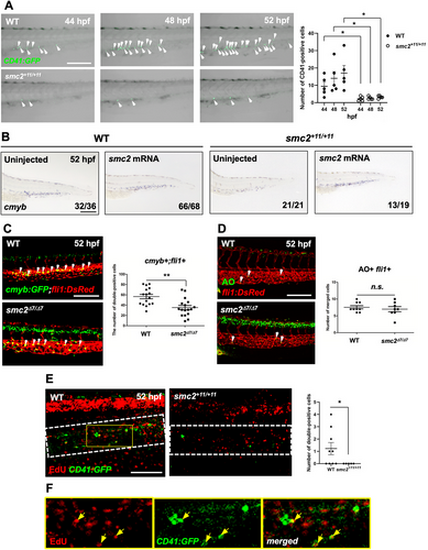
Smc2 is required for HSPC proliferation in the CHT. (A) Confocal imaging of smc2 mutant embryos and sibling controls with a CD41:GFP transgenic background at 44, 48, and 52 hpf. Right panel: quantification of CD41-positive HSPCs in the CHT (WT at 44 hpf, n = 5; mutants at 44 hpf, n = 5; WT at 48 hpf, n = 5; mutants at 48 hpf, n = 5; WT at 52 hpf, n = 5; mutants at 52 hpf, n = 5; *p < 0.05). White arrows indicate CD41-positive HSPCs. Data from a single experiment. (B) WISH of smc2 mutant embryos and WT controls at 52 hpf following injection with smc2 mRNA. Black square brackets indicate the cmyb signal in the CHT. The numbers shown at the bottom of the images represent the count of representative outcomes observed relative to the total number of embryos obtained. Data from two independent experiments. (C) Confocal microscopy images of smc2 mutant embryos and their sibling controls in the cmyb:GFP;fli1:DsRed background. White arrows indicate HSPCs. Right panel: quantification of cmyb+;fli1+ cells in the CHT at 52 hpf (WT, n = 16; mutants, n = 17; **p < 0.01). Data from a single experiment. (D) Confocal imaging of smc2 mutant embryos and WT controls at 52 hpf with acridine orange (AO) staining using fli1:DsRed transgenic zebrafish embryos. White arrows indicate AO-positive apoptotic cells. Right panel: quantification of AO+;fli1+ cells in the CHT (WT, n = 8; mutants, n = 8; n.s., no significance at p > 0.05). Data from a single experiment. (E) Confocal microscopy imaging of EdU-stained (incorporating 24 h) smc2 mutant embryos and WT sibling controls in the background of CD41:GFP at 52 hpf. White-dotted box indicates CHT. Right panel: quantification of EdU- and CD41-double positive cells in the CHT (WT, n = 9; mutants, n = 5; *p < 0.05). The results represent data from two independent experiments. (F) Higher magnification images of the yellow box in EdU-stained WT;CD41:GFP transgenic zebrafish embryos from (E). Yellow arrows indicate EdU- and CD41-double positive cells in the CHT. All quantification data were quantified and expressed as the mean ± SEM. Statistical analysis was performed using a t-test to calculate p-values. Scale bar = 200 μm. |
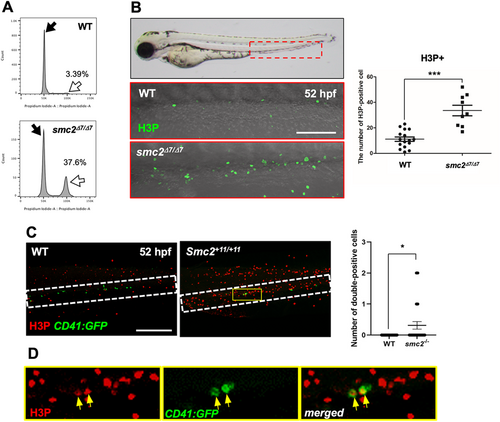
G2/M cell cycle arrest disrupts HSPC maintenance in the CHT in smc2 mutants. (A) Fluorescence-activated cell sorting (FACS) analysis of DNA content in WT and smc2 mutant embryos at 52 hpf following propidium iodide (PI) staining. Black and white arrows indicate the G1 and G2/M phase peak, respectively. The indicated percentage represents the DNA content in the G2/M phase. Data from two independent biological replicate experiments. (B) Confocal microscopy images of smc2 mutants (n = 9) and WT controls (n = 16) immunohistochemically stained with the H3P antibody in the CHT (red-dotted box) at 52 hpf. Red-dotted box indicates CHT. Right panel: quantification of H3P+ cells in the CHT (***p < 0.001). Data combined from two independent experiments. (C) Confocal imaging of H3P-stained smc2 mutant embryos (n = 29) and WT sibling controls (n = 50) in the CHT at 52 hpf using CD41:GFP transgenic zebrafish. White-dotted box indicates CHT. Right panel: quantification of H3P- and CD41-double positive cells in the CHT (*p < 0.05). The results represent data from two independent experiments. (D) Higher magnification images of the white-dotted box in H3P-stained smc2−/−;CD41:GFP transgenic zebrafish embryos from (C). Yellow arrows indicate H3P- and CD41- double positive cells in the CHT of smc2 mutants. All quantification data were quantified and expressed as the mean ± SEM. Statistical analysis was performed using a t-test to calculate p-values. Scale bar = 200 μm. |
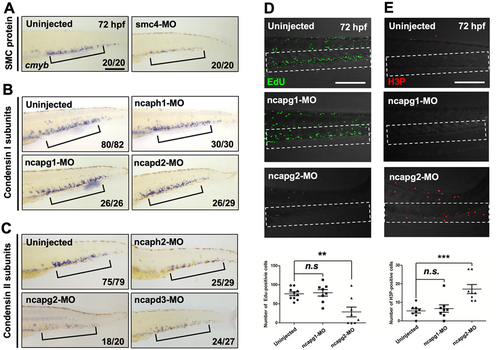
Condensin II subunits are required for HSPC maintenance. (A–C) WISH using the cmyb antisense probe at 72 hpf in WT embryos injected with morpholinos (MOs) targeting smc4 (A), condensin I subunits (ncaph1, ncapg1, and ncapd2) (B), condensin II subunits (ncaph2, ncapg2, and ncapd3) (C), and their corresponding uninjected controls. Black square brackets indicate cmyb-positive HSPCs in the CHT. The numbers shown at the bottom of the images represent the count of representative outcomes observed relative to the total number of embryos obtained. WISH data from a single experiment. (D) Confocal microscopy images of EdU-stained morphants of ncapg1 and ncapg2 and their uninjected controls at 72 hpf. White-dotted box indicates CHT. Bottom panel: quantification of EdU+ cells in the CHT (uninjected, n = 10; ncapg1-MO, n = 10; ncapg2-MO, n = 10; n.s., no significance at p > 0.05; **p < 0.01). Data from a single experiment. (E) Confocal microscopy images of H3P-stained morphants targeting ncapg1 and ncapg2 and their uninjected controls at 72 hpf. Bottom panel: quantification of H3P+ cells in the CHT (uninjected, n = 10; ncapg1-MO, n = 10; ncapg2-MO, n = 10; n.s., no significance at p > 0.05; ***p < 0.001). All quantification data were quantified and expressed as the mean ± SEM. Statistical analysis was performed using a t-test to calculate p-values. Data from a single experiment. Scale bar = 200 μm. |