
|
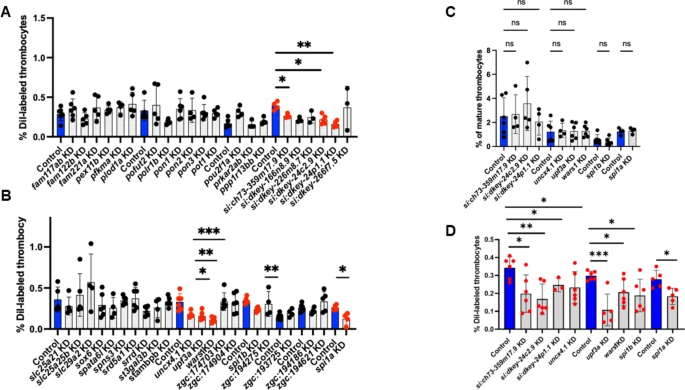
Fig. 2 Quantification of young (DiI-labeled) and mature thrombocytes from flow cytometric data in whole blood after individual gene knockdown in zebrafish. Each of the 42 protein-encoded genes from 14 sets obtained from primary screen was subjected to secondary screening. (A) and (B) DiI-labeled thrombocyte percentages and (C) mature thrombocyte percentages derived from total and DiI-labeled thrombocyte percentages. (D) DiI-labeled thrombocyte percentages of the positives from A and B subjected to knockdown with a different set of ASOs. Daily wild-type (WT) controls are represented by blue bars, while all KDs are depicted as grey bars to the right of the WT daily controls. 4–6 fish were utilized for each KD of the 42 protein-encoded genes and control experiments. The lines above the bars indicate a significant difference between WT and knockdown of each gene. One-way ANOVA was used for statistical analysis. Error bars represent mean ± SD. *, **, and *** represent p ≤ 0.05, p ≤ 0.01, and p ≤ 0.001, respectively. A p-value < 0.05 was considered significant. p > 0.05 was taken as non-significant (ns).