IMAGE

Fig. 6

ID
ZDB-IMAGE-250307-56
Source
Figures for Hu et al., 2025
Image
Figure Caption

Fig. 6

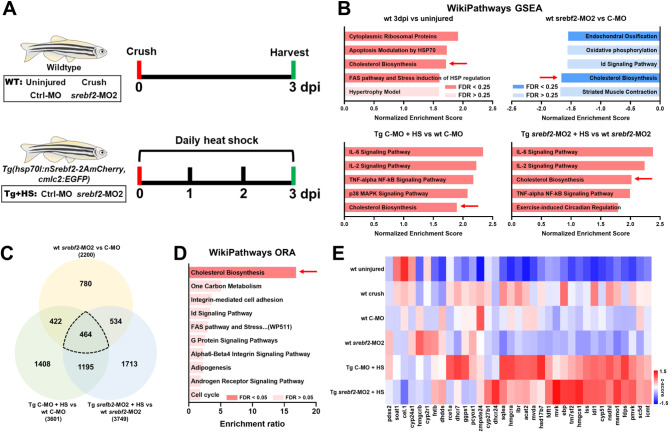
The Cholesterol Biosynthesis pathway is coordinately regulated in the retinal GCL by srebf2 knockdown or constitutively active overexpression at 3 dpi as measured by LCM-seq. A) The six experimental groups being compared by LCM-seq and the heat shock treatment regimen. N = 4 fish per treatment group, two males and two females. B) The mev/chol pathway is up regulated 3 dpi, down regulated by srebf2-MO2 treatment, and up regulated by transgenic (Tg) constitutively active srebf2 over expression in control MO and srebf2-MO2 treated groups (FDR < 0.25). GSEA based on zebrafish Wikipathway. C) Venn diagram for differentially expressed genes (|FoldChange| ≥ 1.5) in the different comparison groups identifies 464 common genes. D) WikiPathways over-representation analysis of the 464 common genes in C enriches for the mev/chol pathway. E) Heatmap of mev/chol synthesis gene expression in each experimental group. 3dpi, uninjured, C-MO, and srebf2-MO2 groups used wt zebrafish; Tg C-MO + HS and Tg srebf2-MO2 + HS used Tg(hsp70l: nSrebf2-2AmCherry, cmlc: GFP) zebrafish with daily heat shock (HS)

Acknowledgments
This image is the copyrighted work of the attributed author or publisher, and ZFIN has permission only to display this image to its users. Additional permissions should be obtained from the applicable author or publisher of the image. Full text @ Mol. Neurodegener.