IMAGE

Fig. 4

ID
ZDB-IMAGE-250307-54
Source
Figures for Hu et al., 2025
Image
Figure Caption

Fig. 4

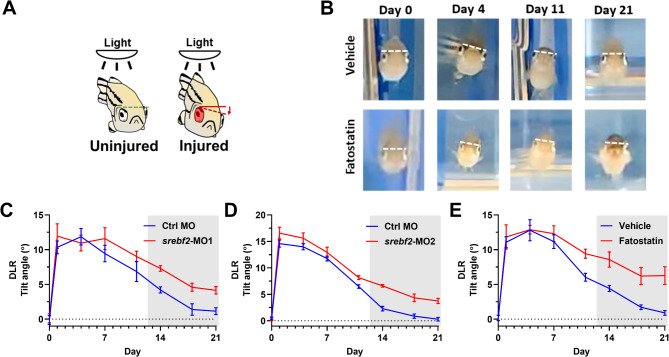
Srebf2 loss-of-function delays dorsal light response (DLR) recovery. (A) Schematic of the DLR. (B) Representative images of the DLR after nerve injury with vehicle or fatostatin treatment over time. (C) Quantification of DLR recovery after control MO (Ctrl MO) or srebf2-MO1 treatment. (D) Quantification of DLR recovery after control MO (Ctrl MO) or srebf2-MO2 treatment. (E) Quantification of DLR recovery after Vehicle or fatostatin treatment. Grey boxes indicate p < 0.05 compared with Vehicle or Ctrl MO at corresponding days post-injury by two-way ANOVA with Bonferroni post hoc test. The dotted line is a 0-degree tilt angle observed at day 0, n = 5–6 for each group

Acknowledgments
This image is the copyrighted work of the attributed author or publisher, and ZFIN has permission only to display this image to its users. Additional permissions should be obtained from the applicable author or publisher of the image. Full text @ Mol. Neurodegener.