
FIGURE 2
|
FIGURE 2
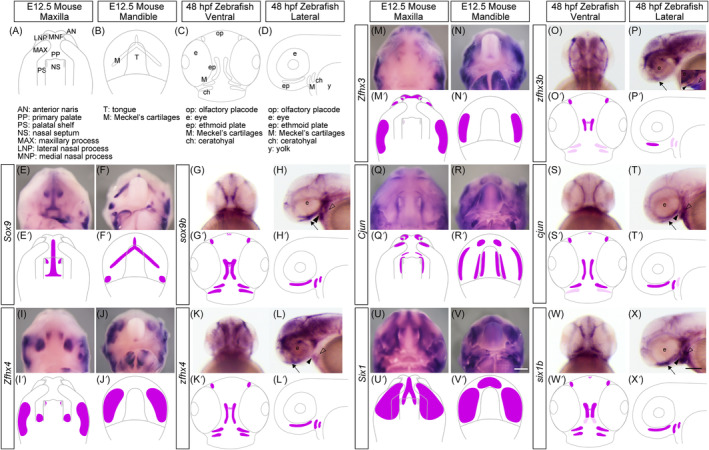
Comparing the expression pattern of the selected genes during craniofacial morphogenesis in mouse and zebrafish embryos. (A–D) Schematic illustrations of the craniofacial anatomy of the maxillary (A) and mandibular (B) regions of mice at E12.5 and zebrafish at 48 hours postfertilization (hpf) (C,D). (E–X) The expression pattern of