
Image
|
Figure Caption
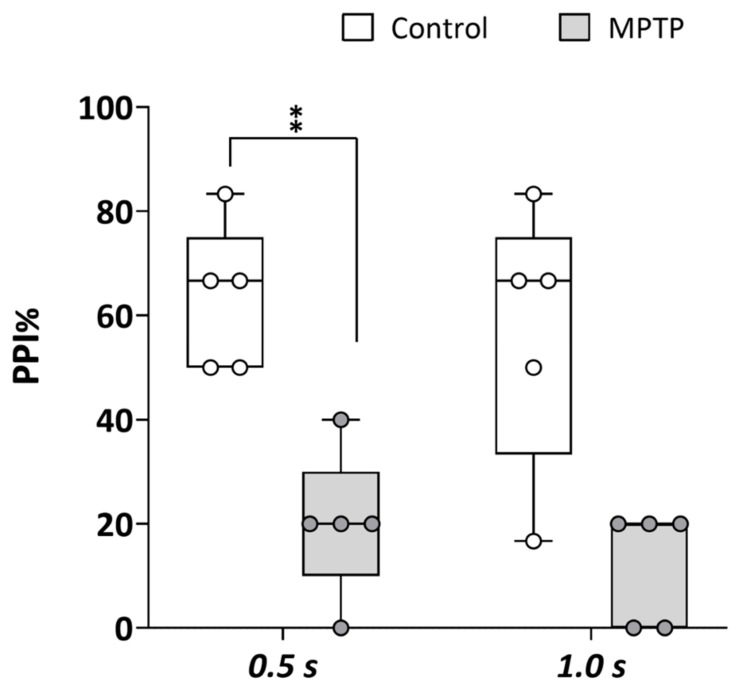
Figure 3
Acute exposure to MPTP leads to a strong decrease in prepulse inhibition (PPI) percentage. The assay was performed using the platform Zebra_K, with 2 different interstimulus intervals between the prepulse and the pulse: 0.5 and 1.0 s. Data are presented as boxplots, where the box indicates the 25th and 75th percentiles, the thin line within the box marks the median, and the whiskers represent the maximum and minimum values, showing all data. **
Figure Data
Acknowledgments
This image is the copyrighted work of the attributed author or publisher, and
ZFIN has permission only to display this image to its users.
Additional permissions should be obtained from the applicable author or publisher of the image.
Full text @ Int. J. Mol. Sci.