
Image
|
Figure Caption
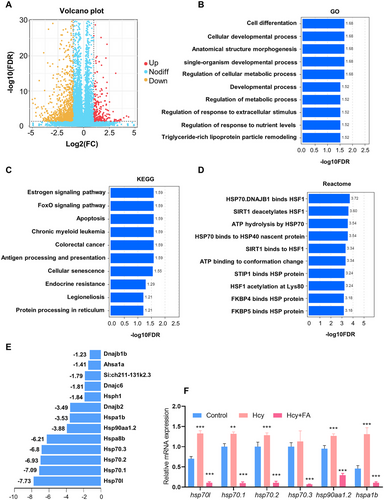
Fig. 5 Hcy regulate the expression of HSP genes in zebrafish embryos: (A) representative volcano of the DEGs; (B) Top 10 enriched in GO analysis of the DEGs; (C) Top 10 enriched in KEGG analysis of the DEGs; (D) Top 10 enriched in Reactome analysis of the DEGs; (E) expression of HSP-related genes of Hcy treatment; and (F) RT-qPCR results showed that Hcy treatment resulted in significant upregulation of major HSP-related genes and folic acid can inhibit this increase.
Acknowledgments
This image is the copyrighted work of the attributed author or publisher, and
ZFIN has permission only to display this image to its users.
Additional permissions should be obtained from the applicable author or publisher of the image.
Full text @ Dev. Neurobiol.