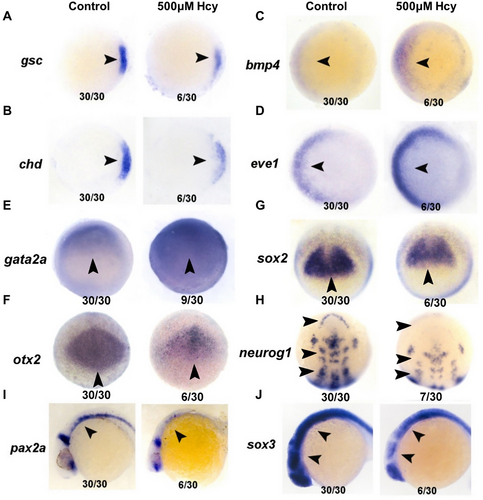
Fig. 3 Hcy treatment results in markedly abnormal expression of genes related to body axis and neurodevelopment in zebrafish embryos: (A–E) the developmental stage at which the marker genes gsc, chd, bmp4, eve1, and gata2a were detected was 6 hpf; (F and G) sox2, otx2 were detected at 7 hpf; (H) Neurog1 was detected at 10 hpf; (I and J) sox3 and pax2a were detected at 24 hpf. The arrows in the figure indicate the position of the gene with differential expression on the embryo, the numbers below on the left indicate the number of embryos of that type, and the numbers on the right indicate the total number of embryos.Hcy treatment results in markedly abnormal expression of genes related to body axis and neurodevelopment in zebrafish embryos: (A–E) the developmental stage at which the marker genes gsc, chd, bmp4, eve1, and gata2a were detected was 6 hpf; (F and G) sox2, otx2 were detected at 7 hpf; (H) Neurog1 was detected at 10 hpf; (I and J) sox3 and pax2a were detected at 24 hpf. The arrows in the figure indicate the position of the gene with differential expression on the embryo, the numbers below on the left indicate the number of embryos of that type, and the numbers on the right indicate the total number of embryos.
Image
Figure Caption
Acknowledgments
This image is the copyrighted work of the attributed author or publisher, and
ZFIN has permission only to display this image to its users.
Additional permissions should be obtained from the applicable author or publisher of the image.
Full text @ Dev. Neurobiol.

