
Image
|
Figure Caption
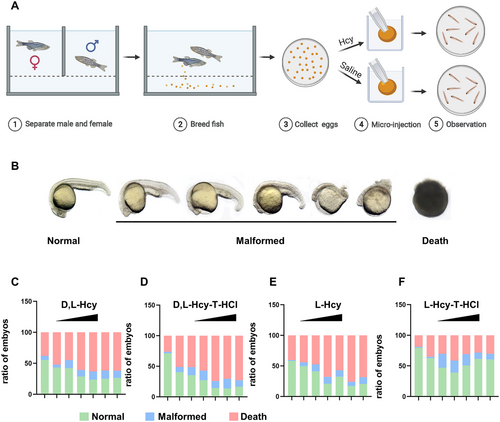
Fig. 2 High Hcy induce neurodevelopmental abnormalities in zebrafish embryos: (A) the flow diagram of Hcy exposure of zebrafish embryos, (B) four forms of Hcy treatment of zebrafish embryos (< 2 hpf) produced malformed phenotypes with progressively increasing severity of malformations; (C–F) the proportion of normal, deformed and dead embryos in each group observed at 24 hpf after without injection and with concentration at 0, 100, 200, 500, 1000, 2000, and 4000 µm of four Hcy forms were treated with zebrafish embryos.
Acknowledgments
This image is the copyrighted work of the attributed author or publisher, and
ZFIN has permission only to display this image to its users.
Additional permissions should be obtained from the applicable author or publisher of the image.
Full text @ Dev. Neurobiol.