
Image
|
Figure Caption
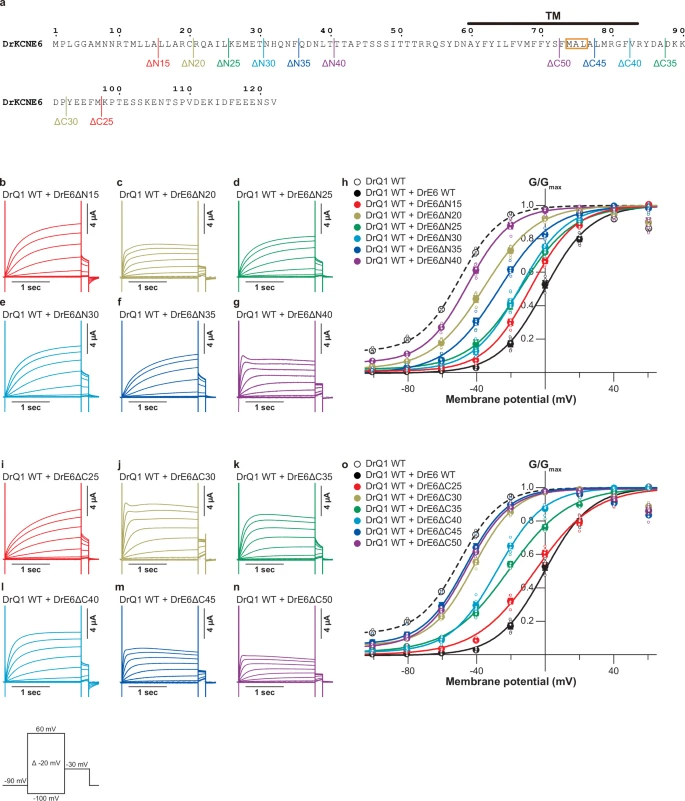
Fig. 4 Regions of KCNE6 important for KCNQ1 modulation.a Diagram of N and C termini truncation constructs of DrKCNE6. Representative current traces (b–g) and G-V relationships (h) of DrKCNQ1 WT alone, DrKCNQ1 WT co-expressed with DrKCNE6 WT, and DrKCNQ1 WT co-expressed with each of the N-terminally truncated DrKCNE6 constructs. Representative current traces (i–n) and G-V relationships (o) of DrKCNQ1 WT alone, DrKCNQ1 WT co-expressed with DrKCNE6 WT, and DrKCNQ1 WT co-expressed with each of the C-terminally truncated DrKCNE6 constructs. Error bars indicate ± s.e.m. for n = 5 in (h,o).
Acknowledgments
This image is the copyrighted work of the attributed author or publisher, and
ZFIN has permission only to display this image to its users.
Additional permissions should be obtained from the applicable author or publisher of the image.
Full text @ Commun Biol