
Image
|
Figure Caption
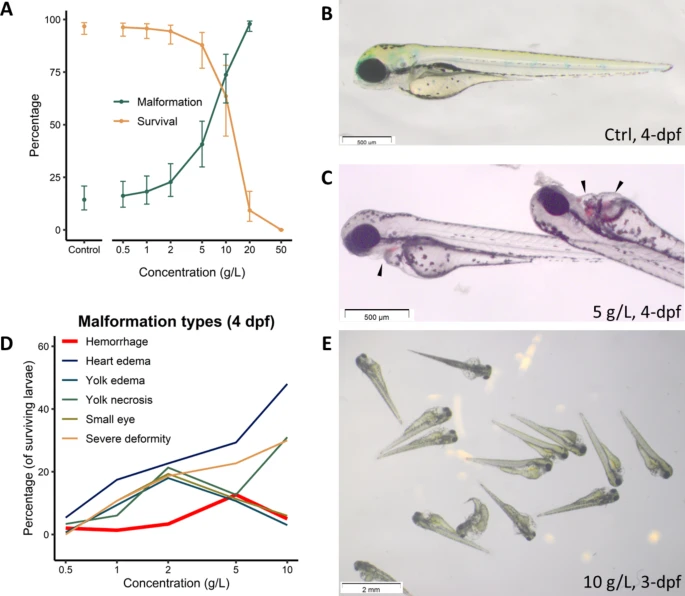
Fig. 1 ZET results for TTZ. (A) Dose-response curves showing survival and occurrence of any malformation induced by 96 h TTZ exposure, X-axis is logarithmically scaled. (B) A control embryo at 4 dpf showing normal morphology. (C) Hemorrhagic sites (arrowheads) induced by TTZ exposure. (D) Percentages of surviving embryos with different phenotypes at 4 dpf (Standard Deviations were excluded for visual clarity). (E) Severe deformities at high TTZ concentration.
Acknowledgments
This image is the copyrighted work of the attributed author or publisher, and
ZFIN has permission only to display this image to its users.
Additional permissions should be obtained from the applicable author or publisher of the image.
Full text @ Sci. Rep.