
|
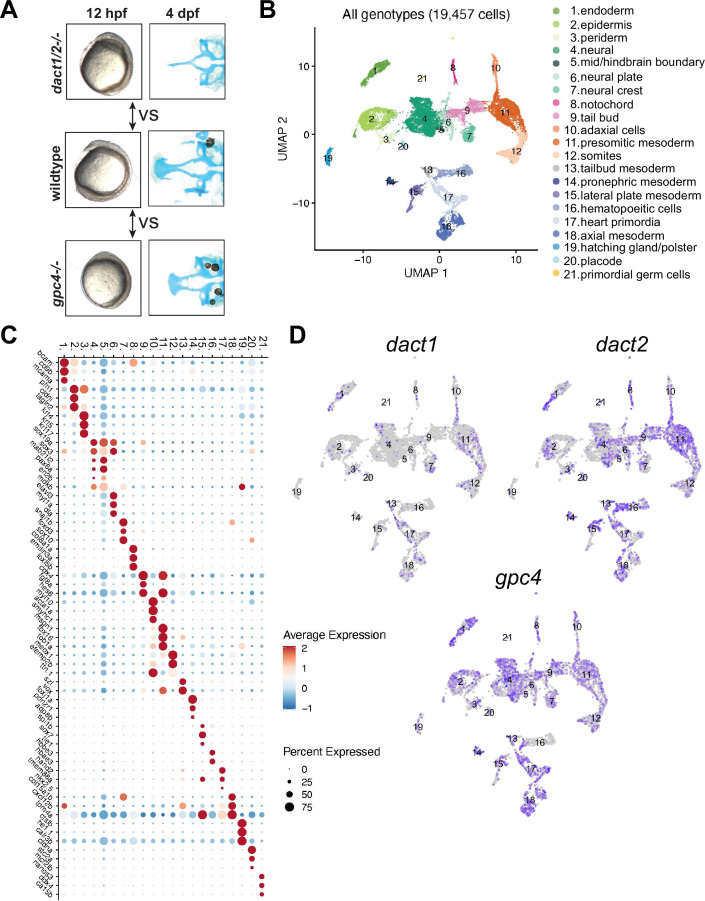
Figure 6 Single-cell RNAseq of 4 ss wildtype, dact1/2−/− mutant, and gpc4−/− mutants. (A) Summary schematic showing similar phenotypes in dact1/2−/− and gpc4−/− mutants at 12 hpf and divergent phenotypes at 4 dpf. Single-cell RNAseq was performed during axis extension to compare and contrast dact1/2−/− and gpc4−/− transcriptional programs. Uniform manifold approximation and projection (UMAP) showing cluster identification. (B) UMAP of cell clusters identified by single-cell RNAseq. (C) Dot plot showing the most differentially expressed genes between clusters. (D) UMAP showing dact1, dact2, and gpc4 expression in wildtype embryos.