IMAGE

Figure 4.

ID
ZDB-IMAGE-241115-87
Source
Figures for Ono et al., 2024
Image
Figure Caption

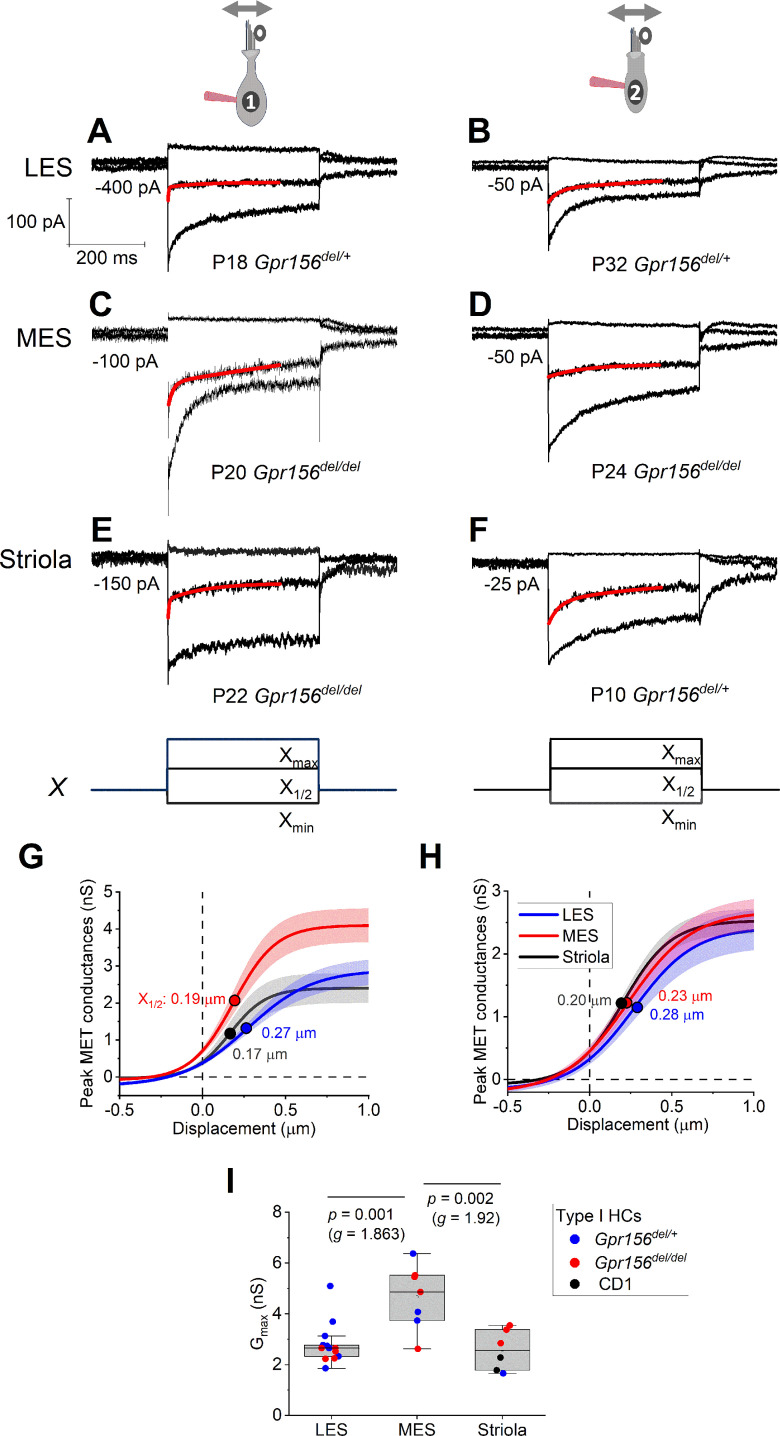
Figure 4. Displacement sensitivity and time course of step-evoked transduction currents in each zone were not strongly affected by Gpr156 deletion.

(A–F) Exemplar IMET recordings from voltage-clamped HCs of different genotype, HC type (columns), and epithelial zone (rows). IMET current families (averages of 3) evoked by 3 of many iterated bundle displacements (E, F), bottom: negatively and positively saturating stimuli plus the step closest to the midpoint (X1/2) of the G(X) relation. Xmax: 1.08–1.32 µm. Xmin: –0.2 to –0.45 µm. Red traces, fits of current decay with Equations 2 or 3 (Methods). Holding potentials, –94 mV (type I) and –84 mV (type II). (G–H) Averaged peak (onset) GMET(X) relations for type I (G) and type II (H) HCs. Data from 5 to 9 HCs of each type were fitted with the Boltzmann functions, which were averaged to produce mean curves shown (± SEM). X1/2 values (filled circles) are given. I Mean maximum GMET of type I HCs was larger in MES than in LES or striola, but there was not a significant effect of genotype. Black circles, 2 striolar type I HCs from CD1 mice.

Acknowledgments
This image is the copyrighted work of the attributed author or publisher, and ZFIN has permission only to display this image to its users. Additional permissions should be obtained from the applicable author or publisher of the image. Full text @ Elife