
|
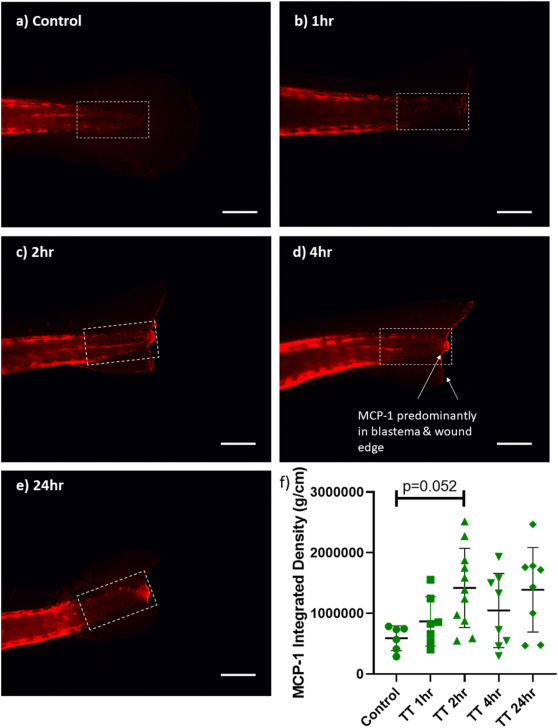
Fig. 6 Representative immunofluorescence images depicting the monocyte chemoattractant protein-1 (MCP-1) response to tailfin transection in zebrafish larvae in a) controls, b) 1hr, c) 2hr, d) 4hr, and e) 24hr post injury. Quantified data and statistical results are presented in frame f (colour correlates to protein depiction in Fig. 9). Graph represents integrated density fluorescent intensity measurements of the defined area of the tailfin. Data are presented as mean ± SEM. Scale bar represents 100 μm. (For interpretation of the references to colour in this figure legend, the reader is referred to the Web version of this article.)