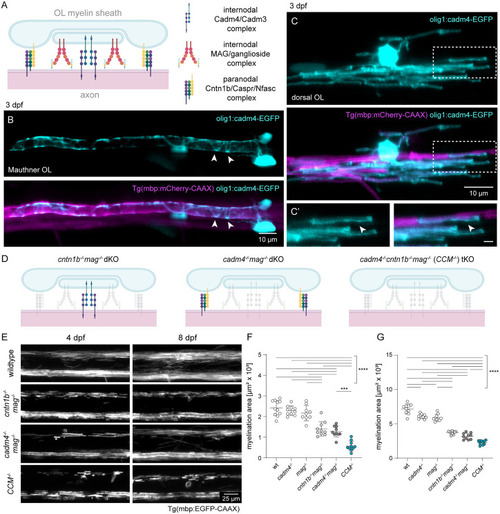
Combined loss of Cadm4, Cntn1b, and Mag leads to severe hypomyelination in the zebrafish spinal cord.
(A) Schematic showing the localization of axo-glial internodal and paranodal adhesion complexes. (B) Confocal image shows a myelinating OL expressing the glial Cadm4 fusion protein olig1:cadm4-EGFP. Cadm4-EGFP (cyan) expression shows a spiraling pattern (arrowheads) across the Mauthner axon, which indicates its localization to the leading edge of the myelin sheath. Myelin sheaths are labeled using the reporter mbp:mCherry-CAAX (magenta). Scalebar is 10 µm. (C) Confocal image shows a myelinating OL expressing the glial Cadm4-EGFP (cyan) in a dorsal spinal cord OL at 3 dpf, showing its localization to cytoplasm-rich areas of the myelin sheaths (arrowheads). The OL is co-labeled using the myelin reporter, mbp:mCherry-CAAX (magenta) (C′ shows zoomed-in images of boxed areas in C). Scale bar is 10 µm for (C) and 5 µm for (C′). (D) Schematic showing the loss of axo-glial internodal and paranodal adhesion complexes in the cntn1b−/−mag−/− dKO, cadm4−/−mag−/− dKO, and the CCM−/− tKO. (E) Confocal images of myelination in the zebrafish spinal cord in wild type, cntn1b−/−mag−/− dKO, cadm4−/−mag−/− dKO, and CCM−/− tKO at 4 dpf (left panels) and 8 dpf (right panels) using the myelin transgenic reporter line Tg(mbp:EGFP-CAAX). Scale bar is 25 µm. (CCM−/−: cadm4−/−cntn1b−/−mag−/−). (F) Quantification of the area of myelination in the dorsal hemi-spinal cord at 4 dpf. (G) Quantification of the area of myelination in the dorsal hemi-spinal cord at 8 dpf. Data was collected from 9-11 fish per genotype for (F and G). Graphs indicate mean values ± SD, analyzed by one-way ANOVA with Tukey’s multiple comparisons test. ***p < 0.001, ****p < 0.0001. Standard deviation projections of the lateral view of the spinal cord shown for (B, C, E). The data underlying this Figure can be found in S1 Data.
|