
Fig. 7
- ID
- ZDB-FIG-250522-13
- Publication
- Qin et al., 2025 - Age-dependent glial heterogeneity and traumatic injury responses in a vertebrate brain structure
- Other Figures
- All Figure Page
- Back to All Figure Page
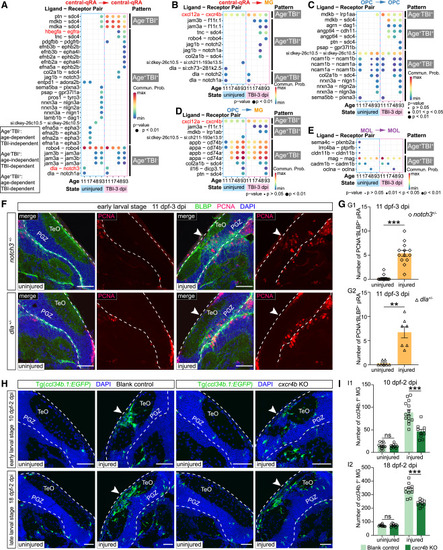
Glia interactome revealed the molecular logic underlying TBI-induced glial responses (A–E) Dot plots showing the ligand-receptor pairs with distinct patterns responsible for partial glial interactions with high communication probability (>1) among the eight conditions shown in Figure S8B. Interacting cell types are annotated above the plot. Age and states of the samples are displayed along x axis (11, 11 dpf; 17, 17 dpf; 48, 48 dpf; 93, 93 dpf), which are grouped as physiological (in blue box) and TBI (3 dpi; in pink box) conditions. y axis lists ligand-receptor pairs and distinct patterns of the interactions, with text-discussed pairs highlighted in red. Commun. Prob., communication probability. (F and G) Representative images (F) and quantification (G) of proliferative radial astrocytes (PCNA+BLBP+) located at central OT in uninjured (left two panels) and injured (right two panels) sides of 11-dpf notch3+/− (upper panel; n = 13 animals) (G1) or dla+/− (lower panel; n = 7 animals) (G2) zebrafish (mean ± SEM; parametric paired t tests; ∗∗p < 0.01, ∗∗∗p < 0.001). (H and I) Representative images (H) and quantification (I) of ccl34b.1+ microglia (green) located at central OT in uninjured and injured sides of the blank-ctrl (left two panels) or cxcr4b-KO (right two panels) Tg(ccl34b.1:EGFP) zebrafish, which were injured at the early-larval stage (upper panel, 10 dpf–2 dpi; blank-ctrl, n = 14 animals; cxcr4b-KO, n = 10 animals) (I1) or late-larval stage (lower panel, 18 dpf–2 dpi; blank-ctrl, n = 11 animals; cxcr4b-KO, n = 10 animals) (I2) (mean ± SEM; one-way ANOVA, followed by Tukey’s HSD test; ns, p > 0.05, ∗∗∗p < 0.001). In (F) and (H), dashed lines indicate OT boundaries, arrowheads indicate the injury sites. Scale bars, 50 μm. Nuclei are visualized by DAPI (blue). |