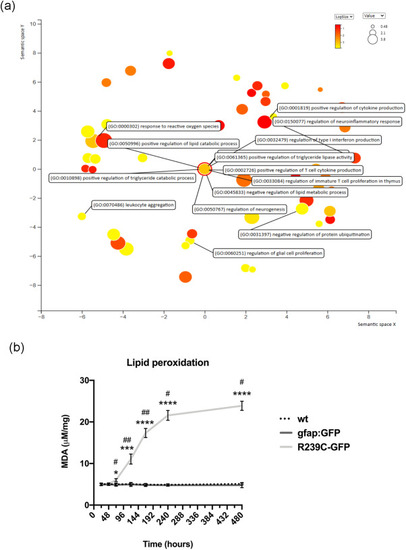
(a) Scatterplot showing the most significant GO terms emerging from the RNA-seq in the zebrafish Tg(gfap:hGFAP(R239C)-GFP) larvae compared to Tg(gfap:GFP)mi2001 controls. Analysis was performed with Revigo, which uses multidimensional scaling (MDS) to reduce the dimensionality of a matrix of the GO terms pairwise semantic similarities. The resulting projection may be highly nonlinear. Connected similar GO terms remain close together in the plot; the semantic space units have no intrinsic meaning. Bubble color indicates the p-value for the false discovery rates; circle size indicates the frequency of the GO term in the underlying GO database, where bubbles of more general terms are larger. (b) Lipid peroxidation accumulation during animal development. The graph shows the intracellular MDA level in wild-type (wt), Tg(gfap:GFP)mi2001 (indicated as gfap:GFP), and Tg(gfap:hGFAP(R239C)-GFP) (indicated as R239C-GFP) larvae from 24 hpf to 20 dpf. Data represent 3 independent experiments (n = 3), and, for each experiment, n = 25 larvae were employed for each sample group). Statistical analysis between the three sample groups was performed with one-way ANOVA followed by Tukey's multiple comparisons test, for each time point analyzed. The difference between a time points and the previous one in the R239C-GFP sample was assessed with the t-test. Statistical significance between groups is reported as follows: ∗∗∗∗/#### < 0.0001; ∗ indicates comparisons between R239C-GFP and wt; # indicates comparisons between the animal's age and previous age in the same condition.
|
