
Fig. 5
- ID
- ZDB-FIG-250416-47
- Publication
- Childers et al., 2025 - Protein absorption in the zebrafish gut is regulated by interactions between lysosome rich enterocytes and the microbiome
- Other Figures
- All Figure Page
- Back to All Figure Page
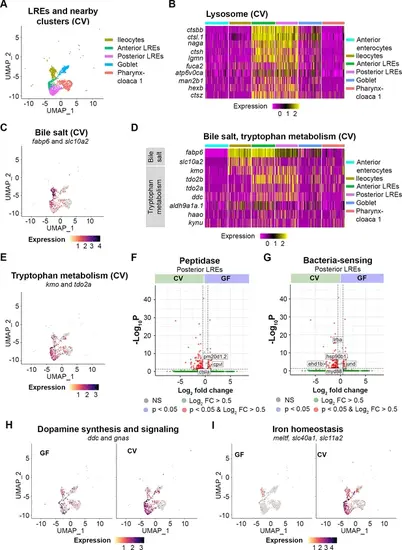
Transcriptomic patterns of anterior and posterior lysosome-rich enterocytes (LREs). (A) UMAP projection shows anterior and posterior LREs, as well as close cell clusters in the conventional (CV) condition. Cell types are color coded. (B) Heatmap illustrates expression of lysosome KEGG pathway genes in LREs and close clusters. The colored bars at the top of the plot indicate the cluster. Heatmap color corresponds to expression intensity. (C) UMAP projection displays expression of the bile salt transport genes fabp6 and slc10a2 in the LREs, ileocytes, goblet, and pharynx-cloaca 1 cells. Cell color indicates cumulative expression intensity for fabp6 and slc10a2. (D) Heatmap highlights expression of bile salt transport and tryptophan metabolism genes in the LREs and close clusters. The colored bars at the top indicate the cell cluster. (E) UMAP projection displays expression of tryptophan metabolism genes kmo and tdo2a in the LREs and close clusters. Cell color indicates cumulative expression intensity of kmo and tdo2a. (F) Volcano plot shows differentially expressed genes (DEGs) between germ-free (GF) and CV posterior LREs. Peptidase genes are tagged. (G) Volcano plot shows DEGs between GF and CV posterior LREs. Genes involved in microbe sensing and inflammatory response are tagged. (H) UMAP projection plots show expression of dopamine synthesis (ddc) and signaling (gnas) genes in GF (left) and CV (right) cells. (I) UMAP projection plots show expression of iron homeostasis genes (meltf, slc40a1, slc11a2) in GF (left) and CV (right) cells. |