|
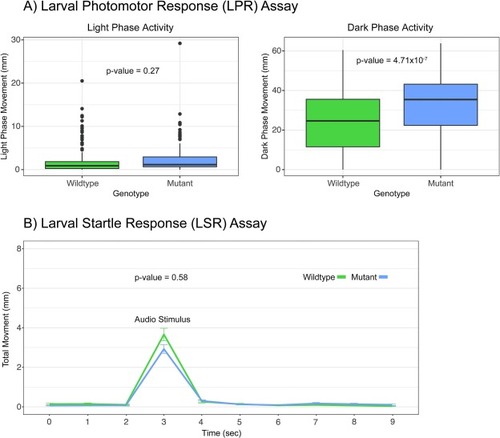
A) Box plots of the larval photomotor response (LPR) assay. The movement in mm during the first light phase is shown in the left figure while movement in the first dark phase is shown in the right figure. CYP1B1 mutant 5dpf larvae did not behave differently during the light phase of the assay but were hyperactive during the dark portion of the assay. P-values = 0.27 and 4.71x10⁻⁷, n = 180, one-way ANOVA. The data within the interquartile range (IQR) was represented by the box, the whiskers represented data 1.5 times the IQR, and any data point beyond that appears as a dot. B) Larval startle response (LSR) assay plotted as time in sec vs total movement in mm. Zebrafish are subjected to an audio stimulus at 3 seconds and should move in response. Response is calculated as area under the curve for the entire period shown. CYP1B1 mutant 5dpf larvae did not behave significantly different during the LSR assay. P-value = 0.58, n = 180, one-way ANOVA.
|