
Fig. 2
- ID
- ZDB-FIG-250120-33
- Publication
- Rajeswari et al., 2024 - Mineralocorticoid receptor activates postnatal adiposity in zebrafish lacking proopiomelanocortin
- Other Figures
- All Figure Page
- Back to All Figure Page
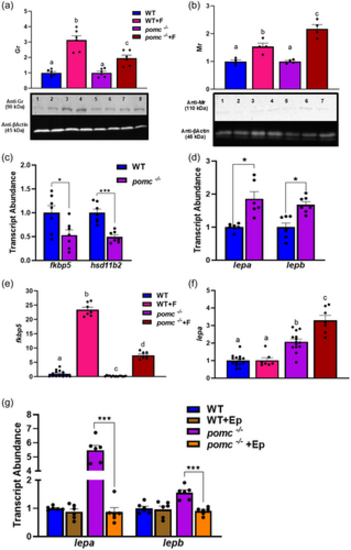
Lack of Pomca increases postnatal mineralocorticoid receptor (Mr) responsiveness. (a) Representative Western blot of 6 dpf larvae showing glucocorticoid receptor (Gr) protein expression (~90 kDa: lanes 1–2 WT, lanes 3–4 WT + F (cortisol), lanes 5–6 pomc-/-, Lanes 7–8 pomc-/- + F). The original unprocessed blot images are shown in the supplemental file (Supporting Information S1: Figure S2). The lower blot shows b-actin expression as a loading control. The bar graph below represents the semi-quantitative image of the Gr band intensity (n = 6, each a pool of 12 larvae, bars with different letters are significantly different, one-way ANOVA, p < 0.05); (b) Representative Western blot of 6 dpf larvae showing Mr protein expression (~110 kDa: lane 1 WT, lanes 2–3 WT + F, lanes 4–5 pomc-/-, lanes 6–7 pomc-/-+ F). The lower blot shows β-actin expression as a loading control. The bar graph shows below represents the semi-quantitative image of the Mr band intensity (n = 4, each a pool of 12 larvae, bars with different letters are significantly different, one-way ANOVA, p < 0.05); (c) Shows the transcript abundance of Gr-responsive genes, fkbp5 and hsd11b2 in 6 dpf WT and pomc-/- larvae. Bars with asterisk (*) are significantly different (t test, *p < 0.05 and ***p < 0.001, n = 6–7, each a pool of 12 larvae); (d) Represent the transcript abundance of Mr-responsive genes, lepa and lepb in 6 dpf WT and pomc-/- larvae. Bars with asterisk (*) are significantly different (t test, *p < 0.05, n = 6-7, each a pool of 12 larvae); (e) Shows the transcript abundance of Gr-responsive gene fkbp5 either without or with cortisol (F) and (f) Shows the transcript abundance of Mr-responsive gene lepa either without or with cortisol (F) in 6 dpf WT and pomc-/- larvae; bars with different letters are significantly different (one-way ANOVA, p < 0.05, n = 7–14, each a pool of 12 larvae); (g) Shows the transcript abundance of Mr-responsive genes, lepa and lepb following eplerenone (Ep) treatment in WT and pomc-/- fish at 6 dpf (t test, n = 5–7, each a pool of 5–8 larvae, ***p < 0.001). The transcript abundance and Western blot results are from the whole larvae. |