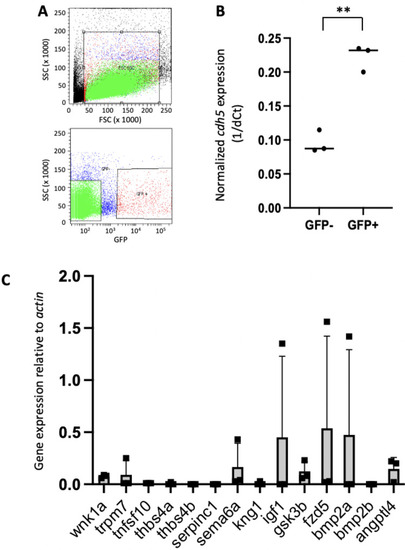
Sorting of EC from fli1a:EGFP; gata1adsRed zebrafish. Approximately 40 Tg(fli1a:EGFP; gata1a:dsRed) embryos at 48 hpf were dissociated into single cells using trypsin. Using FACS, cells were gated using forward scatter (FSC) and side scatter (SSC) and then GFP + and GFP-single cells were sorted. N = 3 independent experiments were performed. (A) Typical flow cytometry data showing FSC and SSC profiles (upper panel; gating indicated as red box) and delineation of GFP + and GFP- single cells (lower panel; gating indicated as red boxes). (B) cdh5 expression was quantified in GFP + cells by qRT-PCR using actin as a control for total RNA levels. Mean 1/dCt values and individual data points are shown. Differences between means were analysed using a t-test. cdh5 expression was enriched in GFP + cells. (C) Quantification of expression of genes of interest in zebrafish endothelium. GFP + cells were analyzed by qRT-PCR. Expression of genes of interest was quantified relative to the expression of actin. Mean values + /− standard deviations and individual data points are shown. Genes which were expressed at detectable levels in one or more experiment were selected for study.
|
