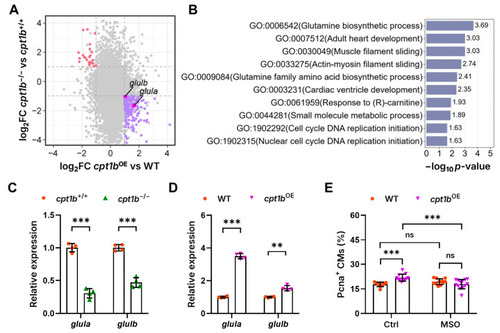
Transcriptomic analysis reveals the potential contribution of Glul in cpt1b-regulated cardiomyocyte proliferation in zebrafish. (A) Nine-quadrant plot illustrating the log2(fold change) of recovered genes in the cpt1b−/− vs. cpt1b+/+ analysis and cpt1bOE vs. WT analysis. Red dots denote genes that were significantly upregulated in cpt1b−/− hearts and concomitantly downregulated in cpt1bOE hearts, blue dots represent genes that were downregulated in cpt1b−/− hearts and upregulated in cpt1bOE hearts, and pink dots highlight the two glutamine synthetase genes. (B) Gene Ontology enrichment analysis of 154 differentially expressed genes revealed significant enrichment of biological processes. The y-axis represents the enriched biological processes, and the x-axis represents the negative logarithm of the p-value. (C) Quantitative RT-PCR analysis of glula and glulb expression in cpt1b+/+ and cpt1b−/− hearts. (D) Quantitative RT-PCR analysis of glula and glulb expression in WT and cpt1bOE hearts. (E) Quantitative analysis of Pcna-positive cardiomyocytes in 4 dpf WT and cpt1bOE zebrafish embryos treated with either vehicle (Ctrl) or 250 µM MSO. n = 10–13. ** p < 0.01, *** p < 0.001, and ns indicates p > 0.05.
|
