|
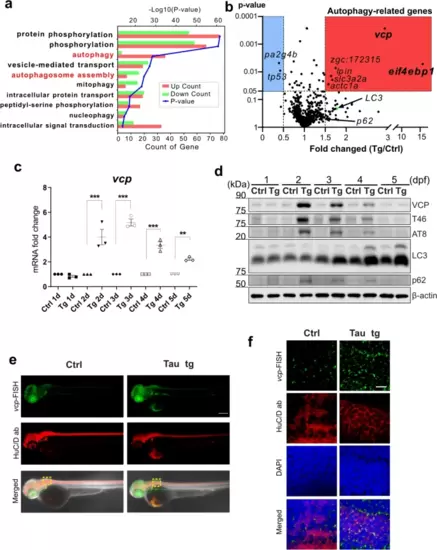
VCP induction correlates with Tau overexpression and clearance. a Top ten GO of DEGs from the comparative transcriptomic analysis of the Tau tg vs the Ctrl line. b A volcano plot of autophagy-related DEGs, identifying vcp and eif4ebp1 as the most significant DEGs with highest p value or fold change. c mRNA expression profile of vcp from 1 to 5 dpf by quantitative RT-PCR. d Western blots with antibodies against Vcp, total Tau (T46), pTau (AT8) and autophagy markers (LC3, p62) for the Ctrl and Tau Tg lines from 1 to 5 dpf. e Whole-mount co-staining of anti-HuC antibody and vcp mRNA fluorescence in situ hybridization (FISH). f Enlarged view of yellow boxes in (e). Student t test, **p < 0.01; ***p < 0.005, Scale bar (in e and f) = 50 µm
|