FIGURE

Fig. 5

ID
ZDB-FIG-240405-41
Publication
Schelch et al., 2022 - YB-1 regulates mesothelioma cell migration via Snail but not EGFR, MMP1, EPHA5 or PARK2
Other Figures
All Figure Page
Back to All Figure Page
Fig. 5

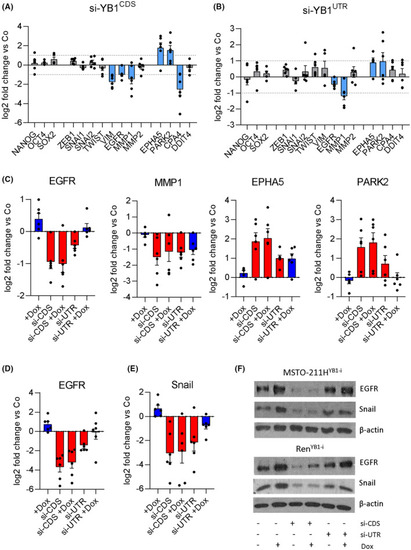
YB‐1 regulates the expression of EGFR and snail. Expression levels of target gene mRNA 48 h after transfection with 5 nm of (A) si‐YB1CDS and (B) si‐YB1UTR, relative to control siRNA transfected cells (Co). Each dot represents the mean of one cell line, derived from three biological replicates performed in duplicates. Data are shown as mean ± SEM. Blue bars indicate a mean log2 fold change > 1. (C) Expression levels of target gene mRNA 48 h after transfection with 5 nm of si‐YB1CDS (si‐CDS) or si‐YB1UTR (si‐UTR) and treatment with 100 ng·mL−1 doxycycline (+dox), relative to control siRNA‐transfected cells (Co). Each dot represents the mean of one cell line, derived from three biological replicates performed in duplicates. Data are shown as mean ± SEM. (D) EGFR and (E) snail protein levels relative to control‐siRNA‐transfected cells (Co) derived from densitometric analysis of western blots (N = 3), 48 h after transfection with 5 nm siRNA and treatment with or without 100 ng·mL−1 doxycycline at the time of transfection as indicated. Each dot represents the mean of one cell line. Data is shown as mean ± SEM. (F) Representative pictures of the western blot.

Expression Data

Expression Detail
Antibody Labeling
Phenotype Data

Phenotype Detail
Acknowledgments
This image is the copyrighted work of the attributed author or publisher, and ZFIN has permission only to display this image to its users. Additional permissions should be obtained from the applicable author or publisher of the image. Full text @ Mol. Oncol.