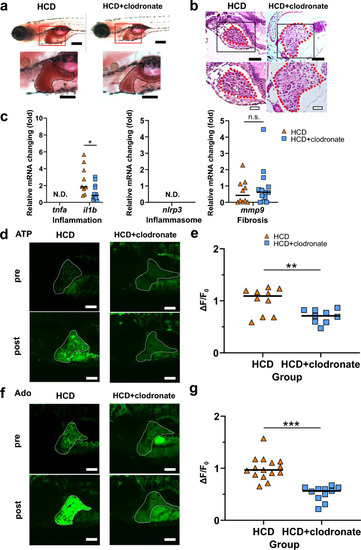
Clodronate improved the MASLD condition correlating with the reduction in extrahepatic ATP and adenosine (Ado) levels. (a) Oil red O staining of the liver (black line) of 8 days postfertilization (dpf) larvae fed a 5% cholesterol diet (HCD) with or without clodronate treatment. Lower-magnification sagittal images (top panel) and higher magnification images (bottom panel). Scale bar 200 µm. (b) Representative hematoxylin and eosin (HE)-stained images of the liver sections (red dotted line) of zebrafish larvae are shown. Lipid droplets are seen in HCD-fed larvae (white arrowheads). Scale bars 40 µm (top panel) and 20 µm (bottom panel). (c) Hepatic mRNA levels of inflammatory genes tnfa and il1b, inflammasome-related gene nlrp3, and fibrosis marker mmp9 were determined in HCD groups of zebrafish larvae with or without clodronate treatment using qRT-PCR. (d,e) Representative images of the liver in GRABATP zebrafish larvae at 8 dpf in the HCD group with or without clodronate treatment. High GFP fluorescence intensity in the liver induced by HCD was reduced by clodronate treatment (bottom panel). Liver: white dotted line. Scale bar 100 μm (d). Quantification of the change in the GFP fluorescence intensity in GRABATP zebrafish larvae without or with HCD treatment (n = 10, 9, each group) (e). (f,g) Representative images of the liver in GRABAdo zebrafish larvae at 8 dpf in the HCD group with or without clodronate treatment. High GFP fluorescence intensity in the liver induced by HCD was reduced by clodronate treatment (bottom panel). Liver: white dotted line. Scale bar 100 μm (d). Quantification of the change in the GFP fluorescence intensity in GRABAdo zebrafish larvae without or with HCD treatment (n = 15, 11, each group) (e). Data are mean ± SEM. *P < 0.05; **P < 0.01; ***P < 0.001 vs. control. N.D. not detected, HCD high-cholesterol diet, n.s. non-significant.
|
