
Fig. 5
- ID
- ZDB-FIG-240112-18
- Publication
- Cheng et al., 2023 - Nodal coordinates the anterior-posterior patterning of germ layers and induces head formation in zebrafish explants
- Other Figures
- All Figure Page
- Back to All Figure Page
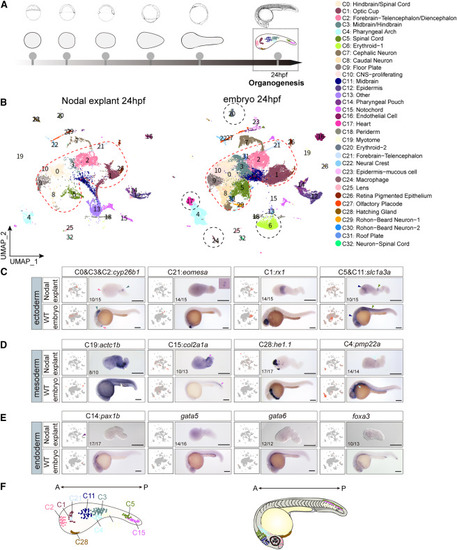
Comparison of cell types and patterns in Nodal explants and embryos at organogenesis stage (A) Schematic representation of collected single-cell transcriptomes of Nodal explants; 24 hpf stage is highlighted. (B) UMAP plot of joint CCA (canonical correlation analysis) clusters of integrated single-cell RNA-seq data (Nodal explants data and published embryonic data at 24 hpf). Cells are colored by clusters. Cell-type annotations and corresponding colors are shown at the right. Dotted black circles in the UMAP indicate clusters were nearly absent in Nodal explants. Red dotted lines indicate CNS clusters. (C–E) UMAP (left, colored by expression level) and ISH (right) revealing expression of selected marker genes of neural ectoderm (C), mesoderm (D), and endoderm (E) in Nodal explants (top) and embryos (bottom) at 24 hpf. (F) Cartoon illustrating the major cell types and their patterns identified in Nodal explants and their corresponding positions in zebrafish embryos at 24 hpf. The statistics of observed/total sampled Nodal explants were shown in bottom left of the panels (biological replicates). Each ISH experiment was performed for at least 3 independent replicates (technical replicates). Scale bars: 200 μm (C–E). See also Figure S4, Table S1, and Data S1. |