
FIGURE
Figure 1
Figure 1
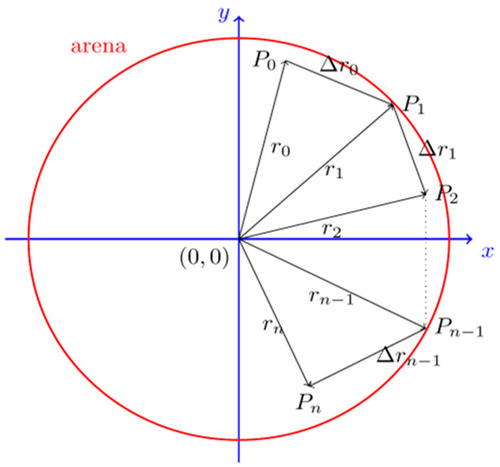
Successive positions of objects over time referred to the frame of reference used by the tracker software. The coordinate axis is represented by blue lines. The red circle represents the arena of radius 8.5 mm. |
Expression Data
Expression Detail
Antibody Labeling
Phenotype Data
Phenotype Detail
Acknowledgments
This image is the copyrighted work of the attributed author or publisher, and
ZFIN has permission only to display this image to its users.
Additional permissions should be obtained from the applicable author or publisher of the image.
Full text @ Biomolecules