
Figure 8
- ID
- ZDB-FIG-230522-49
- Publication
- Almeida et al., 2023 - Early myelination involves the dynamic and repetitive ensheathment of axons which resolves through a low and consistent stabilization rate
- Other Figures
- All Figure Page
- Back to All Figure Page
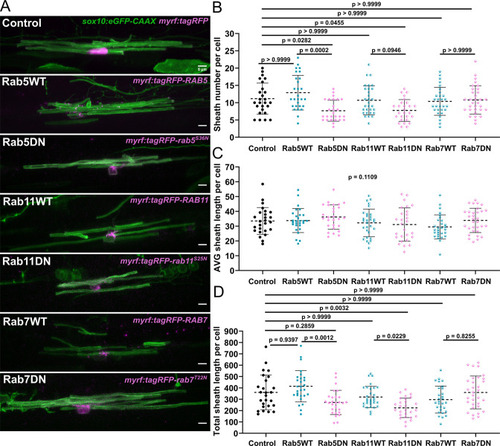
(A) Representative lateral images of ventral oligodendrocytes in the spinal cord of living larvae at 4 days post fertilization (dpf) labeled by sox10:eGFP-CAAX (green) and one of the following: myrf:tagRFP, myrf:tagRFP-RAB5C, myrf:tagRFP-rab5CS36N, myrf:tagRFP-RAB7A, myrf:tagRFP-rab7AT22N, and myrf:tagRFP-RAB11A, myrf:tagRFP-rab11AS25N (all in magenta). The image and data for the control is the same as for the ventral group in Figure 1 (scale bar = 5 μm). (B) Sheath number per cell. (C) Average sheath length per cell. (D) Total sheath length per cell (myrf:tagRFP n=26 cells/26 larvae, myrf:tagRFP-RAB5C n=28 cells/28 larvae, myrf:tagRFP-rab5CS36N n=27 cells/27 larvae, myrf:tagRFP-RAB7A n=29 cells/29 larvae, myrf:tagRFP-rab7AT22N n=32 cells/32 larvae, and myrf:tagRFP-RAB11A n=30 cells/30 larvae, myrf:tagRFP-rab11AS25N n=27 cells/27 larvae). The dashed lines in each plot represent average values with all data points shown. Error bars are standard deviation. Global significance was determined using a Kruskal-Wallis test for B–D. This global p-value is shown for C since it was not significant. Post hoc multiple comparison tests were not performed for this analysis. Post hoc Dunn’s multiple comparison tests were performed to compare groups in B and D. We compared everything with the control group and compared each wild-type and associated mutant with each other. The different Rab groups were not compared with each other (see associated source data).
|