
FIGURE
Fig. 3.
- ID
- ZDB-FIG-230506-26
- Publication
- Bradford et al., 2023 - From Multi-Allele Fish to Non-Standard Environments, How ZFIN Assigns Phenotypes, Human Disease Models, and Gene Expression Annotations to Genes
- Other Figures
- All Figure Page
- Back to All Figure Page
Fig. 3.
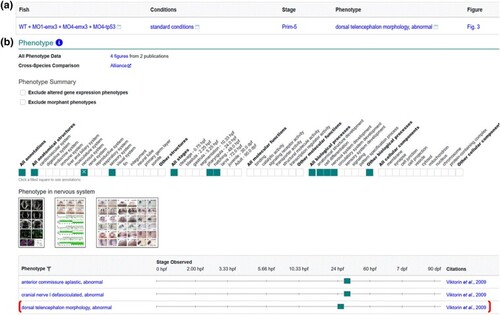
Display of MO-tp53 Fish data on gene page. a) Phenotype data for Fish WT + MO1-emx3 + MO4-emx3 + MO4-tp53 in standard conditions as reported in Viktorin et al. (2009). b) The phenotype summary section on the emx3 gene page has a ribbon that denotes systems, stages, biological processes, and cellular components that have annotations, with individual annotations displayed in the table. Thumbnail images are displayed when available. Phenotype corresponding to Fish in A is denoted by bracket. |
Expression Data
Expression Detail
Antibody Labeling
Phenotype Data
Phenotype Detail
Acknowledgments
This image is the copyrighted work of the attributed author or publisher, and
ZFIN has permission only to display this image to its users.
Additional permissions should be obtained from the applicable author or publisher of the image.
Full text @ Genetics