FIGURE

FIGURE 3

ID
ZDB-FIG-221001-26
Publication
Özsoy et al., 2022 - Volumetric optoacoustic neurobehavioral tracking of epileptic seizures in freely-swimming zebrafish larvae
Other Figures
All Figure Page
Back to All Figure Page
FIGURE 3

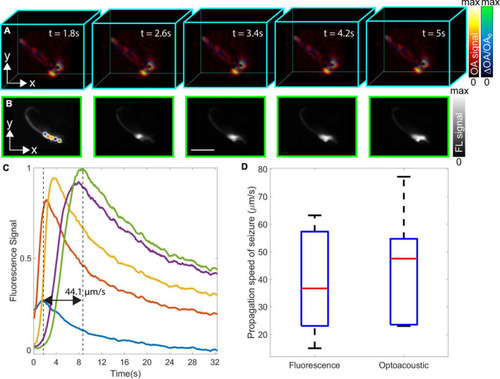
Dual-modality volumetric optoacoustic tomography (OAT) and fluorescence (FL) imaging of neuronal activation in the eaat2a–/– mutant zebrafish larva and estimation of epileptic seizure propagation speed. (A) Relative optoacoustic (OA) signal changes (ΔOA/OA0) from five consecutive time points superimposed on the normalized volumetric OAT image. Light-induced stimulation was initiated at t = 0 s. (B) The corresponding time-lapse FL image sequence. (C) Spatio-temporal plots representing seizure propagation in five different points labeled in blue, orange, yellow, purple, and green colors in panel B. The FL signal peak of blue and green plots corresponds to the 3 and 8 s time points with the speed of seizure propagation calculated as 44.1 μm/s. (D) Boxplots of the propagation speed of epileptic seizures calculated from the eaat2a–/– mutant zebrafish larvae (5 dpf) (n = 7) [FL; mean: 39.6, mean ± σ: (58.6001, 20.5713) μm/s versus OA; mean: 43.5, mean ± σ: (64.3477, 22.5951) μm/s]. Scale bar, 2 mm.

Expression Data

Expression Detail
Antibody Labeling
Phenotype Data

Phenotype Detail
Acknowledgments
This image is the copyrighted work of the attributed author or publisher, and ZFIN has permission only to display this image to its users. Additional permissions should be obtained from the applicable author or publisher of the image. Full text @ Front. Mol. Neurosci.