
FIGURE
Figure 5
- ID
- ZDB-FIG-210128-118
- Publication
- Fish et al., 2021 - Venous Thrombosis and Thrombocyte Activity in Zebrafish Models of Quantitative and Qualitative Fibrinogen Disorders
- Other Figures
- All Figure Page
- Back to All Figure Page
Figure 5
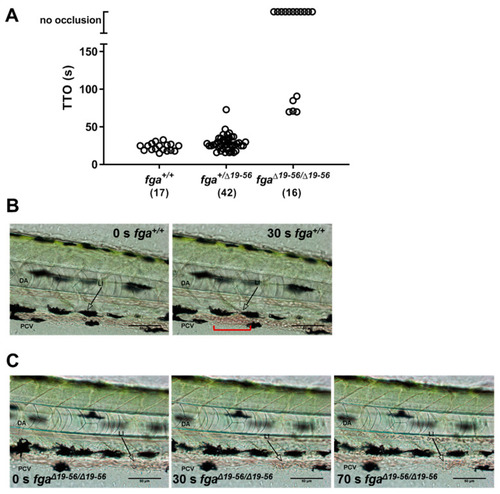
Laser-induced venous thrombosis in a hypodysfibrinogenemia model. (A) TTO for 3 dpf fga+/+, fga+/Δ19–56 and fgaΔ19–56/Δ19–56 larvae. Each circle represents one larva. The number of larvae tested in each group is shown in brackets. (B,C) Time lapse images of fga+/+ and fgaΔ19–56/Δ19–56 larvae upon (0 s) or 30 s after injury. The dorsal aorta (DA), posterior cardinal vein (PCV) and site of laser injury (LI) are indicated. An arrow marks the laser target. A red bracket in the right panel of B highlights the region of thrombus formation. |
Expression Data
Expression Detail
Antibody Labeling
Phenotype Data
| Fish: | |
|---|---|
| Condition: | |
| Observed In: | |
| Stage: | Protruding-mouth |
Phenotype Detail
Acknowledgments
This image is the copyrighted work of the attributed author or publisher, and
ZFIN has permission only to display this image to its users.
Additional permissions should be obtained from the applicable author or publisher of the image.
Full text @ Int. J. Mol. Sci.