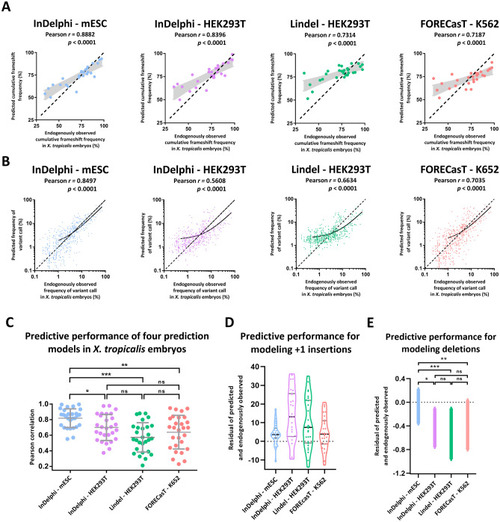
The InDelphi prediction model, trained in mESC cells, accurately predicts CRISPR/Cas9 gene editing outcomes and outperforms several other prediction models in X. tropicalis embryos. (A) Scatter plot with model-predicted cumulative frameshift gene editing frequencies correlated to experimentally observed cumulative frameshift gene editing frequencies, for each sgRNA (n = 28) separately, in X. tropicalis embryos. Black demarcated lines show the perfect correlation r = 1. Light-grey shows the standard error of the best-fit linear regression line. (B) Scatter plot with model-predicted INDEL patterns correlated to experimentally observed INDEL patterns, for all gRNAs simultaneously. Black lines show linear regression models of all correlations. Black demarcated lines show the perfect correlation r = 1. (C) Correlations between model-predicted and experimentally observed INDEL patterns, for each gRNA separately. Error bars represent mean ± SD. (***p < 0.001; **p < 0.01; *p < 0.05; ns = not significant; Shapiro–Wilk (p > 0.05); Levene (p < 0.05); One-way Welsh ANOVA to adjust for unequal variances (p < 0.001), with Games-Howell multiple comparisons) (Table S2). (D) Violin plots of the residuals (predicted frequency—observed frequency) between model-predicted and experimentally observed frequency of + 1 insertion gene editing outcome. (E) The SEM of the mean residual difference (predicted frequency—observed frequency) between model-predicted and experimentally observed frequency of all deletion variants modeled.
|
