|
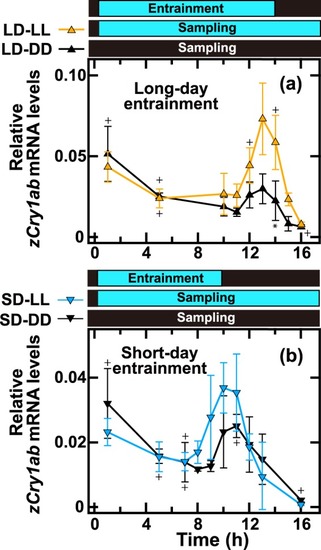
zCry1ab mRNA levels in the eye under constant light (LL) or dark (DD) conditions after entrainment to different photoperiods. (a) Zebrafish were entrained to a 14L:10D long-day cycle and kept in constant blue light (LL; yellow up-pointing triangles) or in the dark (DD; black up-pointing triangles). (b) Zebrafish were entrained to a 10L:14D short-day cycle and kept in constant blue light (LL; blue down-pointing triangles) or in the dark (DD; black down-pointing triangles). Eyes (n = 4, no mark; n = 3, +; n = 2, *) were collected to measure zCry1ab mRNA levels (see Methods for details) at the indicated time points from ZT0 on the last day. Each mRNA level was estimated as a relative value to the geometric mean of mRNA levels of zβ-actin, zGapdh and zEf1α. Data were analyzed by two-way ANOVA (Supplementary Tables S64 and S68) and Tukey-Kramer post-hoc tests (Supplementary Tables S65–S67 and S69–S71). Error bars represent ± SD.
|