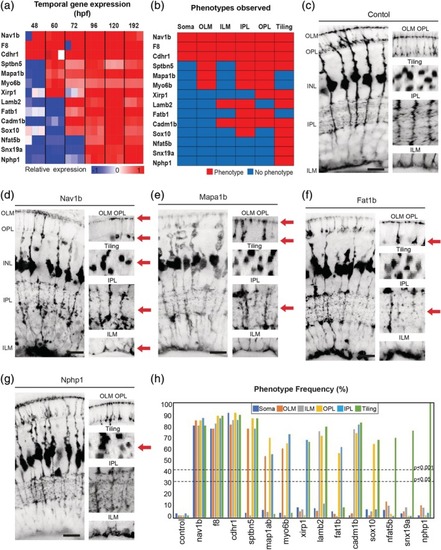
Figure 2
|
Temporal gene expression dictates MG cell morphologies. (a) Heatmap to show the relative gene expression for genes tested. (b) Summary of phenotypes observed for genes enriched across windows of MG cell differentiation. Red—phenotype, blue—no‐phenotype. (c) |
| Fish: | |
|---|---|
| Knockdown Reagents: | |
| Observed In: | |
| Stage: | Day 5 |

