|
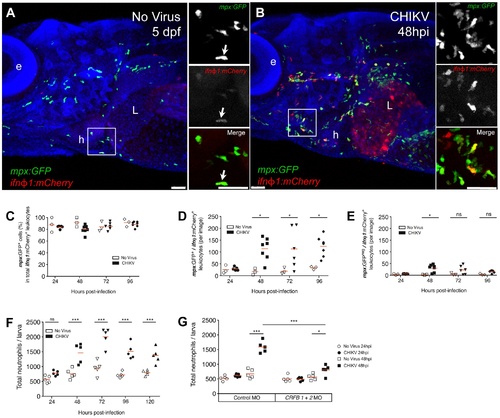
Ifnφ1-expressing leukocytes are mostly neutrophils, which increase in an IFN-dependent manner. (A–E) IHC of anterior region of mpx:GFP/ifnφ1:mCherry double transgenic fish. (A–B) Confocal imaging of an uninfected (A) and CHIKV-115-infected (B) larva at 48 hpi, maximal projection, scale bar 50 μm, mCherry staining in red, GFP staining in green, nuclei in blue (e: eye; L: liver; h: heart); on the right, single color and merged images of the detailed square. (C) Percentage of neutrophils (GFP+) among mCherry+ leukocytes, per field. (D) Number of mCherry+ neutrophils (GFP+) per field. (E) Number of other mCherry+ leukocytes (GFP) per field. For (C–E), N = 3 (No Virus) or N = 5–7 (CHIKV). (F, G) Uninfected or CHIKV-GFP-infected larvae were stained with Sudan Black B to reveal myeloperoxidase granules. Total neutrophil numbers per individual zebrafish were quantified using a stereomicroscope. (F) Neutrophil numbers over time in standard (no morpholino treatment) animals; (G) Neutrophils numbers in interferon receptor knockdown fish (CRFB1+2 MO) compared to control morphants. N = 5 fish per group (***P < 0.001; **P < 0.01; *P < 0.05; ns - not significant).
|