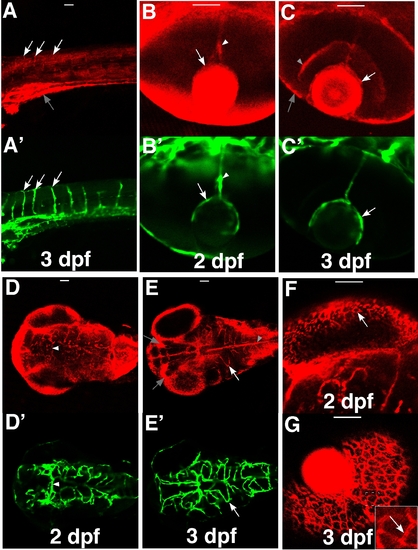
Expression of ZO-1 in the developing BRB and BBB of zebrafish. Tg(flk1:EGFP) embryos at 2 dpf to 3 dpf were stained with rabbit anti-ZO-1; confocal images were analyzed for ZO-1 expression (red) (A-G; Alexa Fluor 568) and blood vessels (green) (A′-E′; EGFP). A&A′, lateral views; the other panels, dorsal views. (A&A′) The ZO-1 signal is high in the gut (shaded arrow) and low in the intersegmental vessels (arrows). (B&B′) At 2 dpf, ZO-1 is localized to the HV (arrows) and the HA (arrowheads). (C&C′) At 3 dpf, the HV (arrows), inner plexiform layer (shaded arrowhead) as well as the outer limiting membrane (shaded arrow) show a strong signal of ZO-1. (D&D′, E&E′) At 2 dpf, most brain vessels express ZO-1, including the BCA (arrowheads). Similar to the claudin-5 antibody, the ZO-1 antibody binds to many non-endothelial structures in the brain (shaded arrows and shaded arrowhead) besides the brain vasculature (arrows). (F&G) At 2 dpf, the ZO-1 antibody can stain the polygonal RPE cells (arrows) clearly. The insert in G is an enlarged view of the dashed square. Scale bars: 50 μm.
|
