|
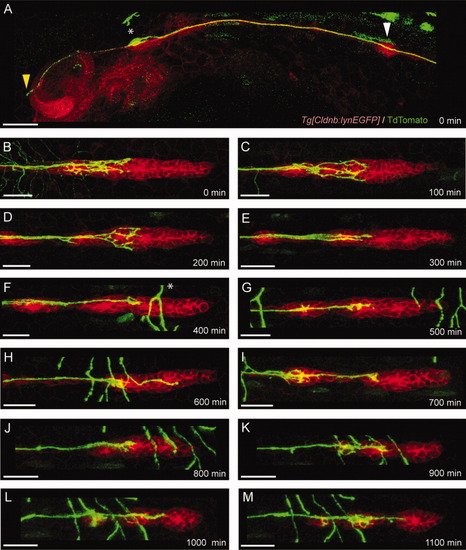
Growth cone morphology over time. A-M: Single lateralis afferent neuron labeled by HuC:mem-TdTomato injection is depicted in green. Asterisk in F indicates other mem-TdTomato-labeled neurons, also shown in green. EGFP fluorescent signal from Tg[CldnB:lynEGFP] transgenic line is shown in red. A: Asterisk and yellow arrowhead indicate the soma and the central projection, respectively. White arrowhead indicates the peripheral projection at the level of neuromast 1. Image acquired at ∼30 hpf. B-M: Growth cone of the neuron depicted in A. Images were taken from ∼30 hpf (B) until ∼48 hpf (M) every 100 min. All images are maximal projections and lateral views. Dorsal is towards top, anterior is towards left. Scale bars = 60 μm (A), 30 μm (B-M).
|