FIGURE SUMMARY
Title

Loss of popdc3 Impairs Mitochondrial Function and Causes Skeletal Muscle Atrophy and Reduced Swimming Ability in Zebrafish

Authors
Sun, C.C., Chen, Z.L., Yang, D., Xiao, J.L., Chen, X.T., Peng, X.Y., Wu, X.S., Tang, C.F.
Source
Full text @ J Cachexia Sarcopenia Muscle

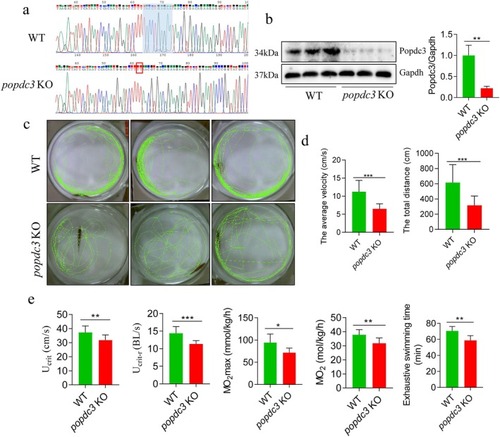
The swimming ability of popdc3 mKO zebrafish was reduced. (a) Sanger sequencing to verify the popdc3 knockdown effect (n = 6). (b) Western Blotting for Popdc3 protein expression (n = 6). (c) Movement trajectories. (d) Average velocity of movement and total distance of movement. (e) Ucrit, Ucrit‐r, MO2max, MO2 and exhaustive swimming time were determined by the Loligo System (n = 15). Data are shown as mean ± SD. *p < 0.05, **p < 0.01 and ***p < 0.001.

Loss of popdc3 leads to muscle loss and induces skeletal zebrafish muscle atrophy. (a) TEM to observe the ultrastructure of skeletal muscle, scale bar = 2 μm. (b) Representative micrographs of H&E stained, scale bar = 20 μm. (c) Representative micrographs of WGA stained, scale bar = 20 μm. (d) CSA (based on WGA staining). (e) Frequency distribution of muscle fibre area (%). (f) Masson staining to observe collagen deposition, scale bar = 20 μm. (n = 3). Data are shown as mean ± SD. *p < 0.05, **p < 0.01 and ***p < 0.001.

popdc3 deficiency promotes zebrafish skeletal muscle protein degradation and inhibits protein synthesis. (a) qRT‐PCR to detect the gene expression of trim63a, trim63b, fbxo32, atg9a, atg9b, atg101, rb1cc1, ulk2 and lc3a. (b) Western blotting was used to detect the protein expression of Murf and Fbxo2 and autophagy‐related proteins (Beclin1 and P62) expression. (c) qRT‐PCR to detect the gene expression of igf1, pik3r2, pik3r4, akt2a, akt3a and ztor. (d) Western blotting was used to detect the protein expression of p‐Pi3k and p‐Akt (n = 6). Data are shown as mean ± SD. *p < 0.05, **p < 0.01 and ***p < 0.001.

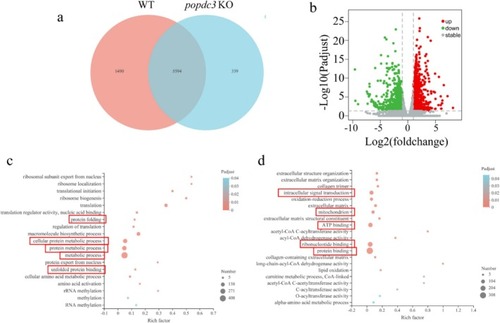
RNA‐Seq analysis of the mechanism of muscle atrophy in popdc3 mKO zebrafish. (a) Venn diagram of the total number of identified genes. (b) Volcano plot constructed using fold change values and Padi value. Red: upregulated; green: downregulated; filtered: nonsignificant. (c) GO terms enriched in upregulated genes. (d) GO terms enriched in downregulated genes (n = 3).

popdc3 deficiency reduces mitochondrial respiratory function in zebrafish skeletal muscle. (a) Heatmap of differentially expressed genes (n = 3). (b) ATP content. (c, d) CS and SDH activities. (e) Real‐time oxygen consumption rate profile of mitochondrial respiration. (f) Activity of Cox I. (g) Activity of Cox I + II. (h) The max ETC capacity (n = 10). Data are shown as mean ± SD. *p < 0.05, **p < 0.01 and ***p < 0.001.

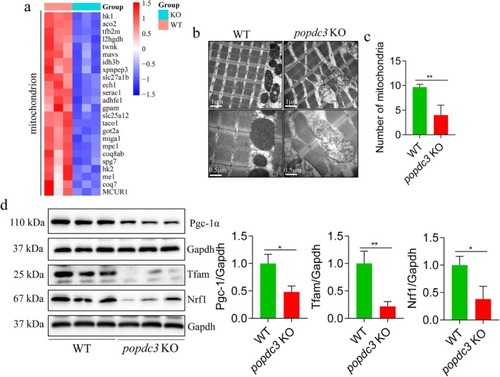
Loss of popdc3 impairs mitochondrial structure and biogenesis in zebrafish skeletal muscle. (a) Heatmap of differentially expressed genes (n = 3). (b) Representative images of mitochondriaTEM, scale bars = 1 and 0.5 μm. (c) Mitochondrial number. (d) Mitochondrial area. (e) Mitochondrial length. (f) Western blotting to detect the protein expressions of Nrf1, Tfam and Pgc‐1α (n = 6). Data are shown as mean ± SD. *p < 0.05 and **p < 0.01.

popdc3 deficiency impairs mitochondrial quality control processes in zebrafish skeletal muscle. (a) Western blotting to detect the protein expressions of Drp1, Fis1, Opa1 and Mfn2 (n = 6). (b) DHE staining (n = 3). Data are shown as mean ± SD. *p < 0.05 and **p < 0.01.

The mechanism of POPDC3 in regulating mitochondrial function and skeletal muscle mass in response to skeletal muscle atrophy.

Acknowledgments
This image is the copyrighted work of the attributed author or publisher, and ZFIN has permission only to display this image to its users. Additional permissions should be obtained from the applicable author or publisher of the image. Full text @ J Cachexia Sarcopenia Muscle