FIGURE SUMMARY
Title

Methyl 3-Bromo-4,5-dihydroxybenzoate Attenuates Inflammatory Bowel Disease by Regulating TLR/NF-κB Pathways

Authors
Huang, J., Li, L., Xu, L., Feng, L., Wang, Y., Sik, A.G., Jin, M., Wang, R., Liu, K., Li, X.
Source
Full text @ Mar. Drugs

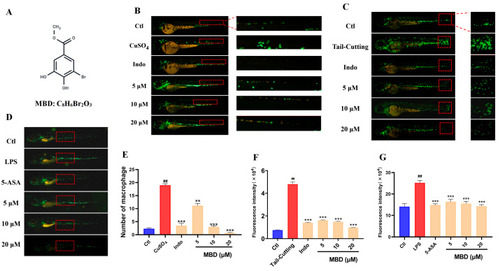
The anti-inflammatory effect of MBD against CuSO4, LPS or tail-cutting. (A) The chemical structure of MBD. Representative images of the anti-inflammatory effects in the CuSO4-induced acute inflammation (B), tail-cutting-induced mechanic damage inflammation (C) and LPS-induced systemic inflammation models (D). (EG) show the statistical analysis of (BD). The migrated and aggregated immune cells shown in the red area were used for the analysis. ## p ≤ 0.01 vs. Ctl; ** p ≤ 0.01 and *** p ≤ 0.001 vs. model.

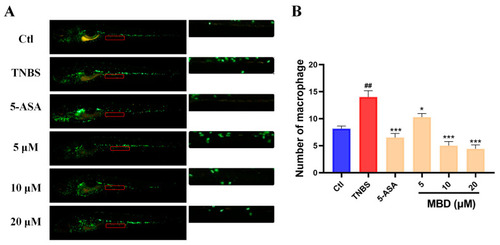
The anti-inflammatory effect of MBD in the zebrafish IBD model induced by TNBS. (A) A representative image. (B) The statistical analysis was conducted on the migrated immune cells shown in indicated red area. ## p ≤ 0.01 vs. Ctl; * p ≤ 0.05, *** p ≤ 0.001 vs. model.

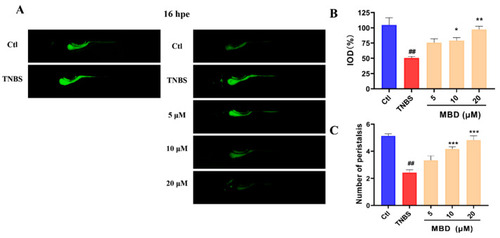
The protective effect of MBD on intestinal peristalsis and efflux activity. The zebrafish was stained with calcein solution for 16 h. (A) Images representative of the zebrafish stained with calcein solution at 0 h and 16 h. (B) The statistical analysis of the integrated optical density (IOD) parameter of the calcein staining. (C) The peristalsis frequency 1 min after calcein staining. ## p ≤ 0.01 vs. Ctl; * p ≤ 0.05 vs. model, ** p ≤ 0.01 vs. model, *** p ≤ 0.001 vs. model.

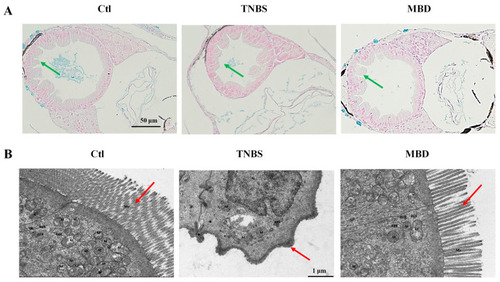
MBD enhanced the integrity of the intestinal structure. Images representative of HE staining (A) and TEM (B). Green arrows indicate the integrity of intestinal mucosal epithelial cells, and red arrows indicate microvilli. M, mitochondria; RER, rough endoplasmic reticulum; Mv, microvilli.

The inhibition of ROS elevation induced by TNBS. (A) Representative florescence images of ROS staining. (B) The statistical analysis of fluorescence IOD. ## p ≤ 0.01 vs. Ctl; ** p ≤ 0.01, *** p ≤ 0.001 vs. model.

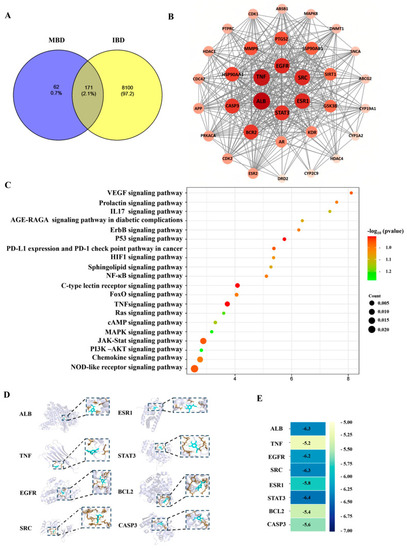
Network pharmacology analysis. (A) The potential targets of MBD (233 genes) and IBD (8271 genes). There are 171 gene targets overlapped with IBD and MBD potential targets. (B) The PPI network of interaction proteins. (C) The KEGG pathways. (D) Molecular docking images of MBD with the potential targets. (E) The combining thermal energy between MBD and the targets.

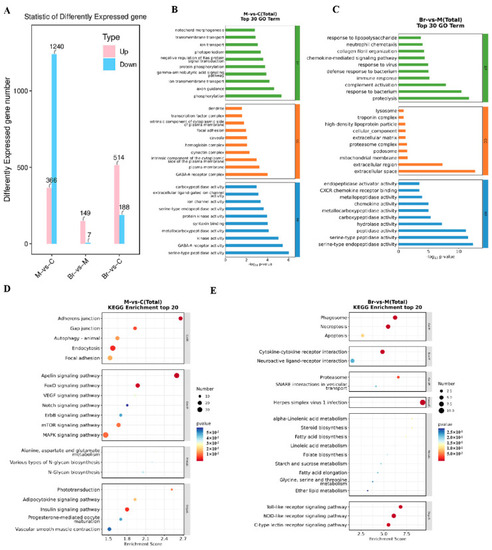
Transcriptome analysis. (A) DEGs between the TNBS, control and/or MBD groups, respectively. The GO analysis between TNBS vs. control group (B) and MBD vs. TNBS group (C). The biological processes, cellular components and molecular functions are shown with green, orange and blue diagrams, respectively. The KEGG enrichment of TNBS vs. control group (D) and MBD vs. TNBS (E). M, TNBS group; C, control; Br, MBD group.

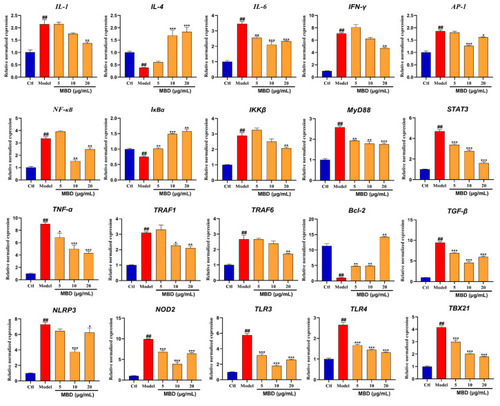
mRNA expression of genes involved in inflammation after MBD exposure. Gene mRNA expression is shown as the relative expression by fold compared to the Ctl. ## p ≤ 0.01 vs. Ctl; * p ≤ 0.05, ** p ≤ 0.01, *** p ≤ 0.01 vs. model.

Acknowledgments
This image is the copyrighted work of the attributed author or publisher, and ZFIN has permission only to display this image to its users. Additional permissions should be obtained from the applicable author or publisher of the image. Full text @ Mar. Drugs