FIGURE SUMMARY
Title

Fin elaboration via anterior-posterior constraint by hhip on Hedgehog signaling in teleosts

Authors
Tanaka, Y., Okayama, S., Urakawa, K., Kudoh, H., Ansai, S., Abe, G., Tamura, K.
Source
Full text @ Development

Paired and median fin skeletons in hhip−/− zebrafish. (A,B) Ventral views of the pectoral fin skeleton of hhip−/− (A) and WT (B) zebrafish. White dashed lines indicate the pectoral girdles. (C,D) Medial views of the pectoral fin skeleton of hhip−/− (C) and WT (D) zebrafish. White dashed lines indicate the first proximal radial (PR1). (E,F) Pelvic fin skeletons of hhip−/− (E) and WT (F) zebrafish. (G,H) Dorsal fin skeletons of hhip−/− (G) and WT (H) zebrafish. (I,J) Anal fin skeletons of hhip−/− (I) and WT (J) zebrafish. Black brackets indicate the post-anal region where the anal fin is formed. (K,L) Caudal fin skeletons of hhip−/− (K) and WT (L) zebrafish. Black dashed lines represent the hypural diastema, and the white arrowheads indicate hypurals in the region ventral to the hypural diastema. Numbers indicate the first to fifth hypurals. The white asterisk marks the first ural vertebra. Ph, parhypural. All observations were performed on five hhip−/− and five WT fish. Double arrows indicate the anterior (A)-posterior (P) axis and the dorsal (D)-ventral (V) axis. Scale bars: 500 µm (C-F); 1 mm (A,B,G,H,K,L); 2 mm (I,J).

Developmental processes of the fin skeletons in hhip−/−zebrafish. (A-F) Pectoral fin development in hhip−/− (A-C) and WT (D-F) zebrafish. Filled and unfilled white arrowheads indicate new and previous subdivisions, respectively, and numbers mark the predicted first to third subdivisions. White dashed lines indicate the first proximal radial (PR1). (G-L) Pelvic fin development in hhip−/− (G-I) and WT (J-L) zebrafish. White arrowheads indicate the radial bones. AnR, anterior large radial; MeR, medial small radial; Pg, pelvic girdle; PoR, posterior elongated radial. (M,N) Caudal fin development in hhip−/− (M) and WT (N) zebrafish. Numbers indicate the first to fifth hypurals. The white asterisk marks the first ural vertebra. Ph, parhypural. These observations were conducted on more than ten larvae at each developmental stage. Green fluorescence indicates the endochondral skeleton marked by col2a1a:EGFP. Double arrows indicate the anterior (A)-posterior (P) axis and the dorsal (D)-ventral (V) axis. The standard length of individuals (in mm) is shown in the bottom left of each panel. Scale bars: 250 µm.

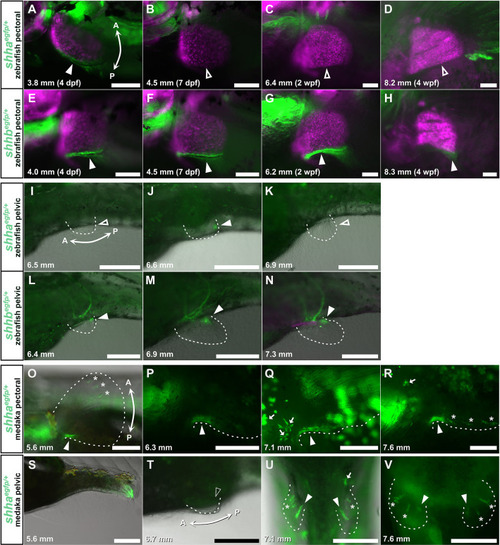
Expression of shhaegfp and shhbegfp in zebrafish, as well as shhaegfp in medaka, during paired fin development. (A-H) EGFP expression in pectoral fin development of shhaegfp (A-D) and shhbegfp (E-H) zebrafish. (I-N) EGFP expression in pelvic fin development of shhaegfp (I-K) and shhbegfp (L-N) zebrafish. (O-R) EGFP expression in pectoral fin development of shhaegfp medaka. (S-V) EGFP expression in pelvic fin development of shhaegfp medaka. All observations were conducted on ten or more larvae at each developmental stage. Magenta fluorescence indicates paired fin skeleton marked by sox10:DsRed. Filled white arrowheads denote EGFP expression and unfilled white arrowheads denote no EGFP expression. Dashed lines outline paired fin buds. Asterisks highlight EGFP expression at the tips of fin rays. White arrows indicate autofluorescence by leucophores. Double arrows mark the anterior (A)-posterior (P) axis. The standard length of individuals (in mm) is shown in the bottom left of each panel. wpf, weeks post-fertilization. Scale bars: 100 µm (A-H); 250 µm (I-V).

Paired fin skeletons in shhb−/−zebrafish. (A,B) Pectoral fin development in shhb−/− (A; n=7/10) and WT (B; n=10/10) zebrafish. For shhb−/− zebrafish, 7/10 larvae exhibited complete fusion of the third and fourth proximal radials in either the left or right pectoral fins. Some shhb−/− zebrafish exhibited a mild defect in the subdivision between the third and fourth proximal radials (A′,A″). Numbers indicate first to fourth proximal radials. (C,D) Pelvic fin development in shhb−/− (C; n=7/10) and WT (D; n=10/10) zebrafish. For shhb−/− zebrafish, 7/10 larvae exhibited pelvic fin loss, with 6/10 larvae exhibiting complete loss of both left and right pelvic fins, and 1/10 larvae exhibiting complete loss of only the left pelvic fin. The white bracket indicates the pre-anal region where the pelvic fins are formed in WT zebrafish. Green fluorescence indicates the endochondral skeleton marked by col2a1a:EGFP. The standard length of individuals (in mm) is shown in the bottom left of each panel. Scale bars: 250 μm (A-A″,B); 500 μm (C,D).

Expression patterns of hhip-related genes in pectoral fins. Bar graphs displaying expression levels (transcripts per million, TPM) at each developmental stage. The TPM of hhip, ptch, shh and and are in order from the top row. The and TPM distinguishes when fin fold formation began [bowfin, from stage (st) 26; zebrafish, from 5 dpf]. Each dot on the graphs represents the value of each replicate. The RNA-seq data of pectoral fins were obtained from previously published bowfin (Thompson et al., 2021) and zebrafish (Kudoh et al., 2024) studies.

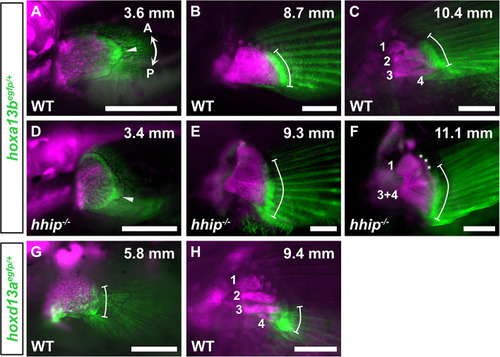
Expression of EGFP by hoxa13begfp and hoxd13aegfp in pectoral fin development of zebrafish. (A-F) EGFP expression induced by hoxa13begfp in pectoral fin development of WT (A-C) and hhip−/− (D-F) zebrafish. (G,H) EGFP expression induced by hoxd13aegfp in pectoral fin development of WT. Numbers indicate the first to fourth proximal radials. White arrowheads indicate significant expression of EGFP by hoxa13begfp. White bars represent the range of EGFP expression. White asterisks denote EGFP expression by col2a1a:egfp on the distal radials. Observations were conducted on more than five larvae at each developmental stage. Magenta fluorescence indicates the paired fin skeleton marked by sox10:DsRed. Double arrows indicate the anterior (A)-posterior (P) axis. The standard length of individuals (in mm) is shown in the top right of each panel. Scale bars: 250 µm.

Summary of pectoral radial changes in zebrafish. Diagram illustrating the pectoral fin skeleton at each developmental stage. The length under the dpf stage indicates approximate standard length. The color bars with gene names indicate gene expression periods. Colors in the 28 dpf section indicate the anterior region where neither Hoxa13 nor Hoxd13 is expressed (red), the median region where Hoxa13 is expressed but Hoxd13 is not expressed (orange), and the posterior region where both Hoxa13 and Hoxd13 are expressed (green).

Acknowledgments
This image is the copyrighted work of the attributed author or publisher, and ZFIN has permission only to display this image to its users. Additional permissions should be obtained from the applicable author or publisher of the image. Full text @ Development