FIGURE SUMMARY
Title

Somatic RIT1 delins in arteriovenous malformations hyperactivate RAS-MAPK signaling amenable to MEK inhibition

Authors
Kapp, F.G., Bazgir, F., Mahammadzade, N., Mehrabipour, M., Vassella, E., Bernhard, S.M., Döring, Y., Holm, A., Karow, A., Seebauer, C., Platz Batista da Silva, N., Wohlgemuth, W.A., Oppenheimer, A., Kröning, P., Niemeyer, C.M., Schanze, D., Zenker, M., Eng, W., Ahmadian, M.R., Baumgartner, I., Rössler, J.
Source
Full text @ Angiogenesis

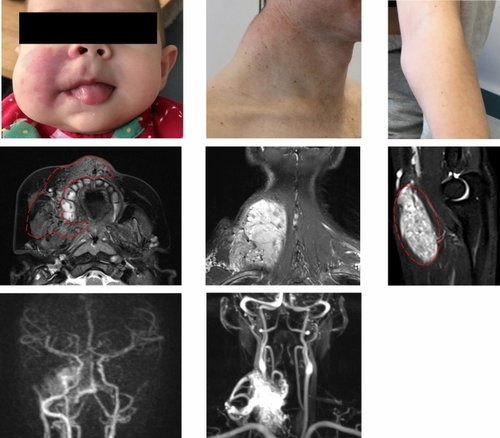
Three patients with somatic RIT1 variants identified in AVM tissue. a Patient P1 displays a capillary malformation and swelling of the right side of the face. b MRI of P1 at the age of 4 months, the image of a transversal T2 TSE sequence, in which an AVM could be detected; the extent of the lesion is labelled with red dashed line indicating soft tissue edema and flow-voids. c The MR angiography shows increased perfusion on the right side of the face (left side within the panel). d Patient P2 shows a prominent mass of the left cervical/nuchal area. e MR imaging (coronal T2 sequence with fat saturation), which shows the hyperintense isolated intramuscular lesion, flow-voids seen within the lesion representing high AVM flow, and disfiguring overgrowth. f MR angiography, which shows the large AVM connected to the subclavian and the thyrocervical trunk with multi-chambered central nidus. g Clinical aspect of the Patient P3 with swelling on the left forearm, close to the medial side of the elbow. h T2W sagittal images demonstrating a well-defined fusiform shaped hyperintense lesion involving the flexor muscle (pronator teres) of the forearm. Flow voids (red dashed line) are seen within the lesion representing arterial blood vessels. MRI Magnetic Resonance Imaging

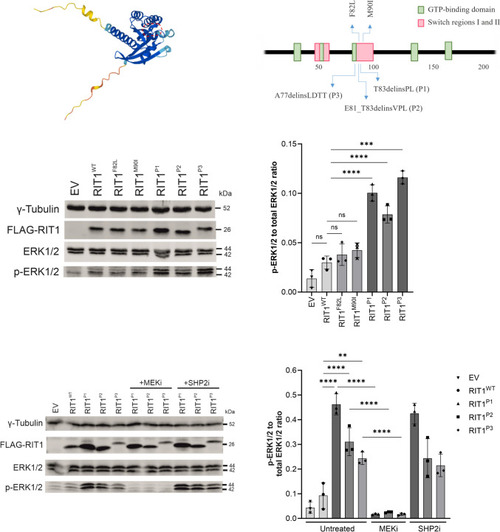
ERK phosphorylation after expression of RIT1 variants in vitro in HEK293T cells. a Protein structure of RIT1 predicted by AlphaFold, accessed through ensemble.org. The area labelled by the dashed red line indicates the switch 2 domain. b Schematic drawing of RIT1 functional domains of human RIT1 protein (green boxes = GTP-binding regions; red boxes = switch domain 1 and 2; blue arrows (upward) = two mutations typically found in Noonan syndrome; blue arrows (downward) = mutations identified in P1-P3. c Western blot after expression of RIT1 variants to assess RAS-MAPK pathway activation. Gamma tubulin served as loading control, FLAG-RIT1 confirms the expression of the construct, total ERK levels serve as a control to exclude the differential expression of ERK, and p-ERK measures the level of phosphorylate of ERK as a marker of RAS pathway activation. d Quantification of the ERK phosphorylation was measured in a total of three western blots for each variant (n = 3). One-way ANOVA. P value ***< 0.001; ****< 0.0001, ns = not significant. Data are presented as mean ± SD. EV = empty vector. e Western blot after expression of RIT1 variants and with or without treatment using a MEK inhibitor or SHP2 inhibitor. The same parameters were assessed as in panel d. f Quantification of the ERK phosphorylation was measured in a total of three western blots for each variant (n = 3). One-way ANOVA. P value **< 0.01; ****< 0.0001, ns = not significant. Data are presented as mean ± SD

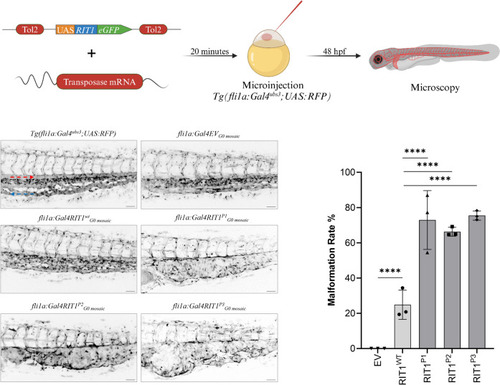
Endothelial-specific mosaic expression of RIT1 variants leads to the formation of AVM in zebrafish embryos. a Experimental layout: The plasmid containing human wildtype RIT1 or RIT1 variants, under the control of a UAS element and linked to GFP with a P2A sequence is mixed with transposase mRNA and injected into the one-cell stage of Tg(fli1a:Gal4; UAS:RFP) embryos. Thereafter, embryos are examined at 48 hpf. b Vascular network in the tail of an uninjected Tg(fli1a:Gal4; UAS:RFP), EV and RIT1 variants injected embryos. Arrows represent the direction of arterial and venous blood flow (red and blue arrow, respectively). Note the malformed vasculature with a fusion of the dorsal aorta and the caudal vein as well as dilation of the vessel. Scale bar 50 µm. c Quantification of the vascular anatomy at 48 hpf following the injection of plasmids containing the indicated RIT1 variants, with and without treatment. n = 3. Number of total examined embryos: EV = 66, RIT1WT = 92, RIT1P1 = 67, RIT1P2 = 97, RIT1P3 = 61. Fisher’s exact test, two-tailed. P value ****< 0.0001. Data are presented as mean ± SD. EV empty vector

RIT1 variants injected zebrafish embryos respond to early and late treatment with MEK inhibitor trametinib. a Experimental plan to assess the effect of trametinib on the RIT1 injected zebrafish embryos after early and late treatments. Embryos are treated with trametinib either from 14hpf or 48 hpf on followed by an examination at 48 hpf (early treatment) or 96 hpf (late treatment) respectively. Presence of vascular malformation is calculated for early treatment embryos. Malformation area is calculated before and after trametinib treatment for each embryo in the late treatment group. b Quantification of the vascular anatomy at 48 hpf following the injection of plasmids containing the indicated RIT1 variants and treatment at 14 hpf. Experiments were performed with three biological replicates. Number of total examined embryos post-treatment: RIT1WT = 73, RIT1P1 = 60, RIT1P2 = 51, RIT1P3 = 38. Fisher’s exact test, two-tailed. P value *< 0.05, ***< 0.001; ****< 0.0001. Data are presented as mean ± SD. c Quantification of the relative change in the size of the AVM-like lesions after 2 days of treatment. Experiments were performed with three biological replicates. Number of total examined embryos: RIT1P1 = 48, RIT1P2 = 40, RIT1P3 = 46. Unpaired t-test, two-tailed. P value **< 0.01; ***< 0.001; ****< 0.0001. Data are presented as mean ± SD. d Example of image analysis to measure the relative change of lesion size during trametinib treatment from 2 to 4 dpf. Scale bar 50 µm

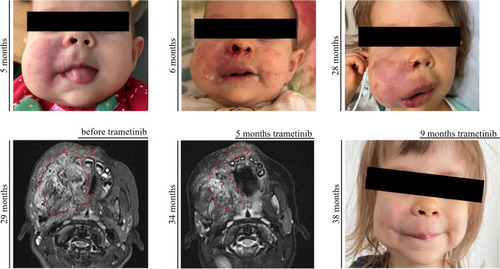
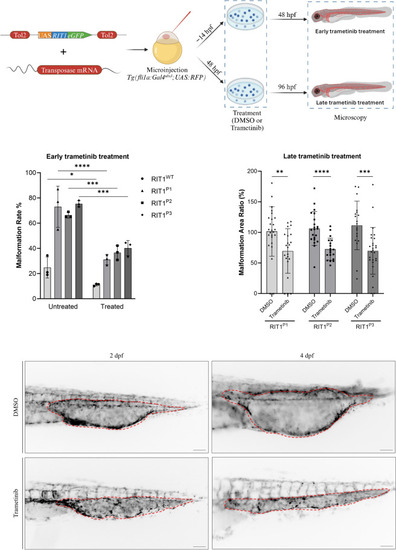
Response to targeted therapy in P1. a Patient P1 at 5 months of age. b Patient P1 at 6 months of age (after a bleeding episode). c Patient P1 at 28 months of age, showing a significant and progressive enlargement of the right cheek due to the AVM. d MRI (transversal T2 STIR) of the Patient P1 before the start of trametinib treatment; red dashed line indicates the extent of the AVM. e MRI (transversal T2 TSE Dixon) of the Patient P1 after 5 months of treatment with trametinib; red dashed line indicates the now smaller extent of the AVM. f Patient P1 at 38 months of age, reduced volume of the right cheek and fading of the capillary malformation can be noted

Acknowledgments
This image is the copyrighted work of the attributed author or publisher, and ZFIN has permission only to display this image to its users. Additional permissions should be obtained from the applicable author or publisher of the image. Full text @ Angiogenesis