
Fig. 2
- ID
- ZDB-IMAGE-260530-139
- Publication
- Tsai et al., 2026 - Zebrafish gon4la mutants recapitulate human GON4L-related growth disorders and reveal novel metabolic organs abnormalities
- All Figures
- Figures for Tsai et al., 2026
|
Fig. 2
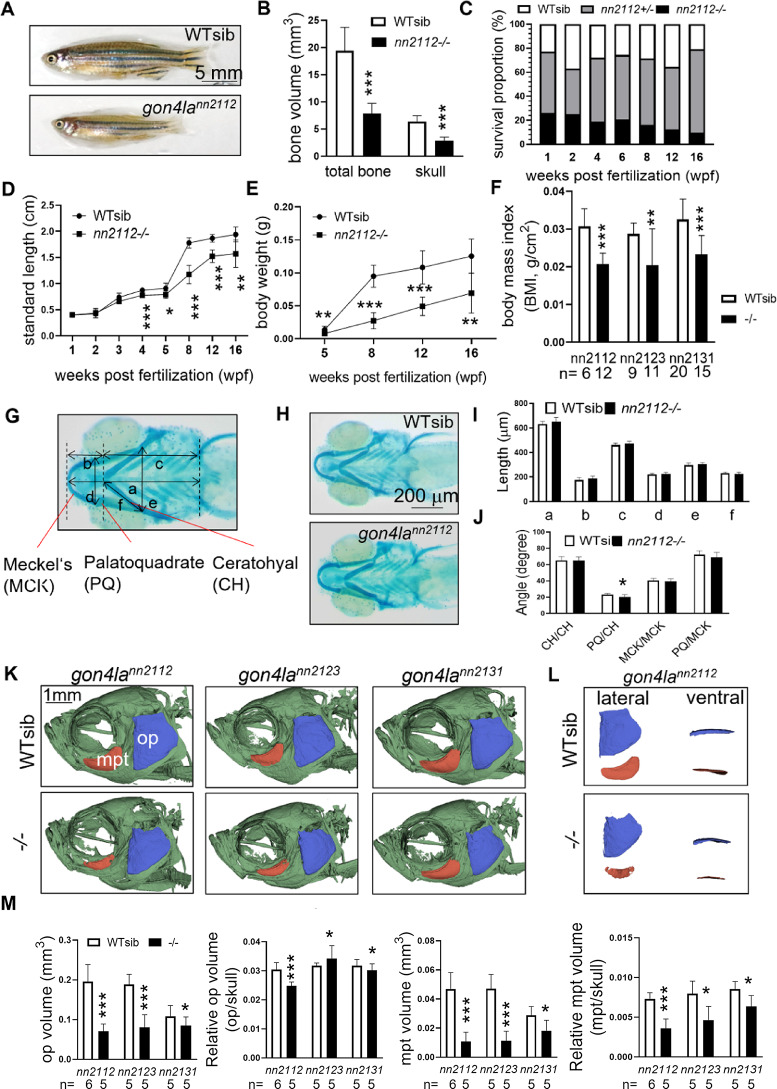
gon4la mutants show impaired growth and delayed craniofacial development. (A) Reduced body size and (B) significantly smaller total bone and skull volume in gon4lann2112 mutants (3 mpf, n = 5/group). (C) Survival proportions of gon4lann2112 homozygotes begin to decline after 12 wpf (Genotyping n ≥ 96/time point). (D, E) Growth metrics (length and weight) show delayed growth post-8 wpf (n ranges from 10/4 at 1 wpf to 11/6 at 16 wpf for WT/homo). (F) Comparison of body mass index (BMI) across all three mutant lines, showing a systemic reduction in body mass relative to length. (G, H) Craniofacial bone structure of WT siblings and gon4lann2112 mutant larvae stained with Alcian blue at 5 dpf. (I) Quantification of six distinct length measurements (a–f), including total head length, ceratohyal cartilage length, and various joint distances, as indicated in (G). (J) Quantification of four key craniofacial cartilage angles: ceratohyal cartilages (CH/CH), palatoquadrate and ceratohyal (PQ/CH), Meckel’s cartilages (MCK/MCK), and palatoquadrate and Meckel’s cartilage (PQ/MCK) (n = 9–10/group). (K) µCT images of 3–4 mpf skulls (lateral view): Opercle (op, blue) and metapterygoid (mpt, red) are segmented and labeled. (L) Representative lateral and ventral views of segmented op and mpt from WT siblings and gon4lann2112 mutants. (M) The sizes of op and mpt and their ratios to skull size were analyzed in all three mutant lines (n = 5–6/group).