
Image
|
Figure Caption
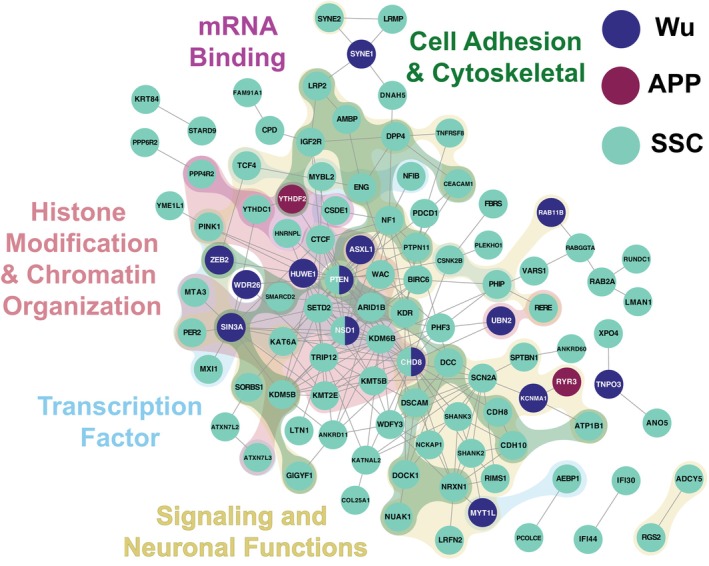
FIGURE 2
Network analysis and gene ontology (GO) of ASD‐DM candidate genes. ASD‐DM candidate genes from SSC (teal), APP (purple), and Wu (navy) probands are connected in a network via active interactions as determined by STRING (Szklarczyk et al.
Acknowledgments
This image is the copyrighted work of the attributed author or publisher, and
ZFIN has permission only to display this image to its users.
Additional permissions should be obtained from the applicable author or publisher of the image.
Full text @ Autism Res