IMAGE

Fig. 10

ID
ZDB-IMAGE-250512-63
Source
Figures for Fargher et al., 2025
Image
Figure Caption

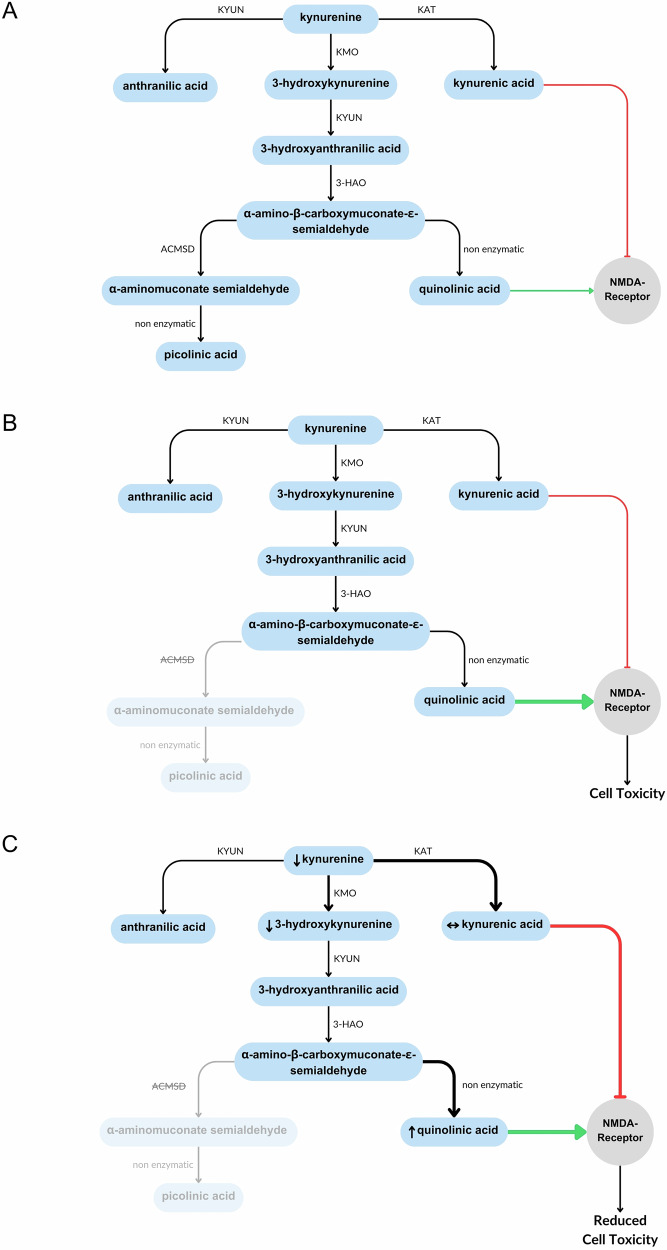
Fig. 10 Summary of kynurenine pathway metabolite changes in acmsd-/- zebrafish.

A The basic kynurenine pathway. B Expected effect of reduced acmsd activity. C Results of metabolomics data from acmsd-/- zebrafish. Small arrows show measured changes in metabolites in acmsd-/- zebrafish compared to acmsd+/+. Arrow thickness represents pathway activity.

Acknowledgments
This image is the copyrighted work of the attributed author or publisher, and ZFIN has permission only to display this image to its users. Additional permissions should be obtained from the applicable author or publisher of the image. Full text @ NPJ Parkinsons Dis