IMAGE

FIGURE 7

ID
ZDB-IMAGE-250501-61
Source
Figures for Konar et al., 2025
Image
Figure Caption

FIGURE 7

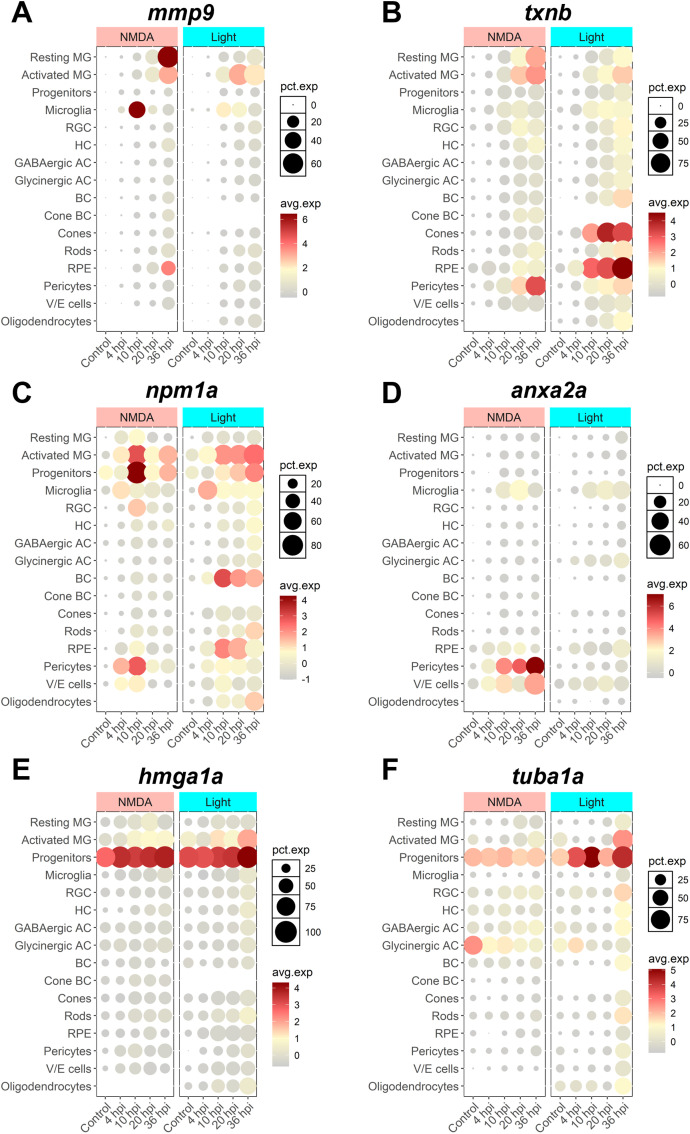
scRNAseq visualization of SASP factors after NMDA and light damage. Localization of SASP factor expression based on scRNAseq data from dissociated retinas was visualized using Seurat and the plot1cell package. (A)mmp9 expression was elevated in MG, microglia, and RPE. (B)txnb expression was elevated in MG and pericytes in both damage models, and cones and RPE in light damage only. (C)npm1a expression was elevated in MG, progenitors, microglia, pericytes, and bipolar cells. (D)anxa2a expression was elevated in microglia, pericytes, and vascular/endothelial cells. (E, F)hmga1a and tuba1a expression were largely elevated in progenitor cells. The average normalized expression within each cluster and the percentage of cells in each cluster expressing each gene of interest is shown. MG = Müller glia, RGC = retinal ganglion cell, HC = horizontal cell, AC = amacrine cell, BC = bipolar cell, RPE = retinal pigment epithelium, V/E cells = vascular endothelial cells.

Acknowledgments
This image is the copyrighted work of the attributed author or publisher, and ZFIN has permission only to display this image to its users. Additional permissions should be obtained from the applicable author or publisher of the image. Full text @ Front Aging