
Image
|
Figure Caption
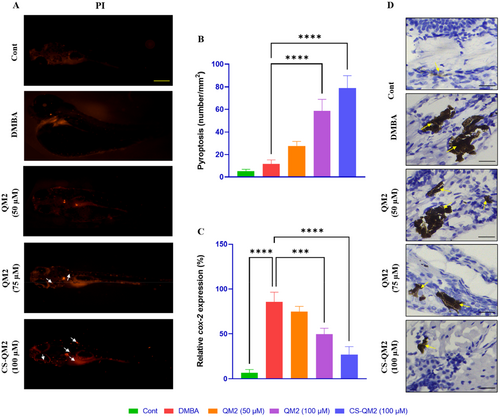
Fig. 10 Representation of the cell death and cox-2 expression in zebrafish larvae. (A) Fluorescent photomicrograph of zebrafish larvae stained with PI; white arrow indicates pyroptosis, scale bar: 400 µm; (B) Quantification of pyroptosis; (C) Quantification of cox-2 expression level; (D) Photomicrograph of an immunohistochemistry of zebrafish larvae expressing cox-2; yellow arrow indicates cox-2 expression, scale bar: 30 µm. Data are presented as mean ± standard deviation of replicates. The asterix represents the statistical significance compared to the DMBA group.
Acknowledgments
This image is the copyrighted work of the attributed author or publisher, and
ZFIN has permission only to display this image to its users.
Additional permissions should be obtained from the applicable author or publisher of the image.
Full text @ J. Biochem. Mol. Toxicol.