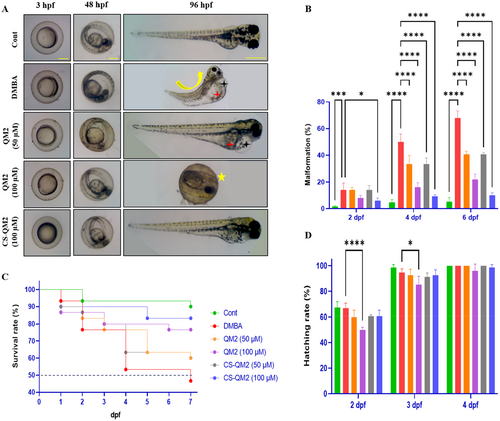
Fig. 3 Effect of the QM2 compound and CS-QM2 nanoparticle on the DMBA induced malformations in zebrafish larvae. (A) Photomicrograph of developmental analysis on eleuthero embryos for 96 h. (B) Quantitative analysis of malformation rate. (C) Kaplan-Myers graph of zebrafish embryo survivability assay. (D) Hatching rate of zebrafish embryo. Data are presented as mean ± standard deviation of replicates. The asterix represents the statistical significance compared to the DMBA group. Black star – pericardial edema; Curve line – scoliosis; Red star – yolk sac edema; Yellow star – delayed hatching. Scale bar: 100 µm and 400 µm.
Image
Figure Caption
Acknowledgments
This image is the copyrighted work of the attributed author or publisher, and
ZFIN has permission only to display this image to its users.
Additional permissions should be obtained from the applicable author or publisher of the image.
Full text @ J. Biochem. Mol. Toxicol.

